A Second Level Look at the Eagles Defense

10th in points allowed, 8th in yards allowed.

Those numbers are seductive. Maybe this Eagles defense wasn’t as bad as we thought. Maybe, counter to conventional wisdom, Juan Castillo doesn’t have to be fired. Maybe he’s already figured things out.

If you feel those sentiments catching up to you, it’s time for an intervention. Total points allowed, total yards allowed are flawed statistics at best. Imparting any meaning to them requires understanding them in the context of a host of other statistical factors.

When we take the whole picture into account, the picture of the Eagles defense doesn’t look so rosy after all.

Opponents

Here’s a list of the Eagles opponents, ranked by offensive efficiency (Football Outsiders DVOA):

  • NWE #3
  • NYG #7
  • DAL #11
  • ATL #12
  • BUF #16
  • SF #18
  • WAS #19
  • MIA #20
  • NYJ #21
  • SEA #22
  • ARI #28
  • CHI #30
  • STL #32

The Eagles played one elite offense this season: the Patriots. They only faced one other offense in the top ten, and Juan Castillo could pull a gameplan off the shelf for that one. Same with the Cowboys, who the Eagles faced once with Tony Romo and once without.

Next you have the Falcons, the juggernaut that couldn’t manage a single offensive point against the Giants this weekend, along with the Bills and 49ers, offenses that represent the height of mediocrity. Every other opponent the Eagles faced was as bad — or worse (!) — than the Rex Grossman-led Redskins.

Consistency

If you want to win week in and week out in the NFL, you can’t have wildly variable performances week by week, let alone quarter by quarter.

The Eagles defense had good moments, for sure, especially against the worst NFC East in years. But they could never sustain that success. We lived that roller-coaster ride throughout the season. So it’s unsurprising to note that the defense had the second-worst variance rate of any team in the NFL.

But even more telling is the volatility throughout a single game. The Eagles were 11th in the NFL in points allowed through the first three quarters. But in the fourth, that dropped to 25th.

That wasn’t an anomaly. Castillo’s defense was consistently out-schemed and out-played late in games. The Cardinals, for example, engineered a comeback largely by exploiting coverages that they knew were coming. That will lose you games even when you look alright on the stat sheet.

Situational

Carrying along from inconsistency, it’s worth noting that the Eagles defense wasn’t bad at everything. Much like the Jim Johnson defenses of old, which relied on a bend-but-don’t-break approach, Castillo’s unit had its own pluses and minuses.

Unfortunately, the 2011 Eagles had more of the break-but-don’t-bend qualities.

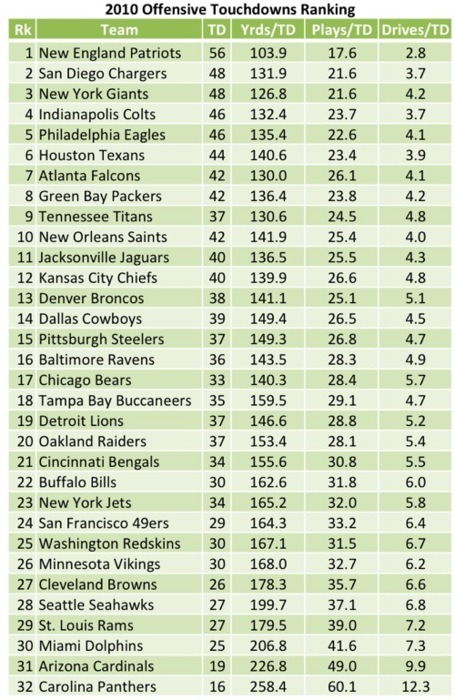
For example, the defense ranked 8th in the NFL in first downs per drive. That means they stalled out a large number of opponent drives — a positive indicator. That led to the Eagles allowing the 9th-fewest points per drive.

However, these numbers come with large caveats. For starters, the Eagles allowed the second-fewest number of field goal attempts in the league, and opponents converted a league-low 66 percent of those attempts. Some of that is indicative of good defense, some just of luck.

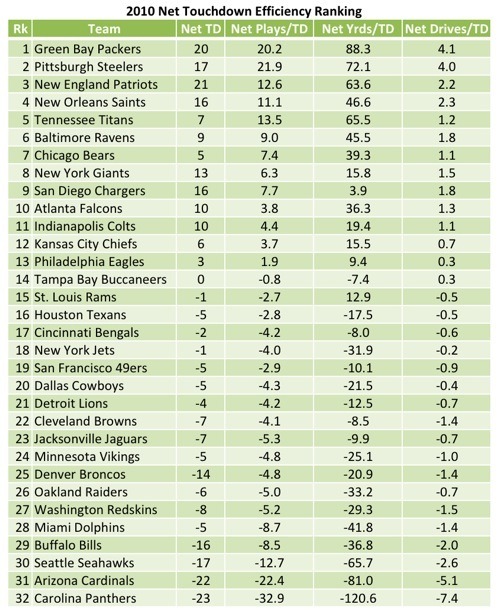
More importantly, despite fewer first downs, the Eagles were below average (19th) in touchdowns allowed per drive. Why? Two reasons. For the second straight season, the Eagles had an atrocious red zone defense (60 percent TDs allowed). The defense also allowed far too many big plays. They were 4th-worst in the NFL in 40-yard plays given up per drive.

Again, some things were great. Jim Washburn’s defense line posted the most sacks in the league. But at the same time, the Eagles were 24th in first downs allowed by penalties (unsurprising), and 22nd in turnovers (surprising). Not enough positives to outweigh the negatives.

* * *

In short, that’s how you can end up with seemingly solid overall points and yards allowed, without actually having a defense good enough to win more than eight games. And it’s also why Juan Castillo needs to go… or at the very least be demoted post-haste.
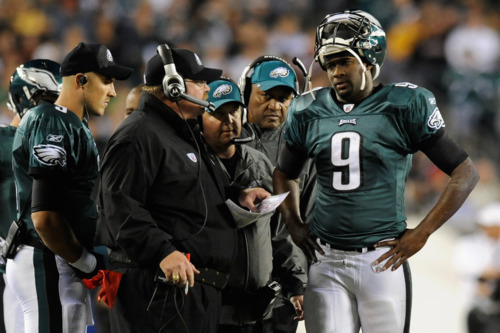
Photo from Getty.

By the Numbers: A Fall From Grace

Andy Reid Vince Young Eagles

At the end of Sunday’s game two players were firmly seated on their respective benches. One was Tom Brady, leader of an elite but far from perfect team, who took a rest after amassing a three touchdown lead. The other was DeSean Jackson, talented underachiever on a league-basement team, who was benched for poor play while the Eagles were trying desperately to come back.

There may be a more apt and fair comparison, but to me that distinction illustrates exactly how far the Eagles have fallen. They used to be an elite squad. Not anymore.

Let’s check the numbers:

7 = Times the Patriots entered Eagles territory. They scored 5 touchdowns and went 1 for 2 on field goal attempts on those 7 possessions. That touchdown percentage would be worst in the league for opponent trips to the red zone, let alone crossing the 50 yard line.

2 = Official tackles by Jamar Chaney. There is no doubt that on Sunday Chaney missed more tackles than he made. See the entries under “No need for linebackers” and “fundamentally sound” in the Eagles coaching handbook.

400 = Largely worthless passing yards by Vince Young. That is, however, a single game career high.

40% = Completion percentage on passes targeted at DeSean Jackson. Young’s total would have been even higher if not for Jackson letting two touchdowns and another 75 to 100 yards slip through his fingers. DeSean’s stock has never been lower. It is increasingly likely not only that he’s playing for another team next season but that the Eagles won’t be able to get back much for his services.

10 = Eagles penalties, for 60 yards.

6 = First half carries by LeSean McCoy. The Patriots secondary is bad and the Eagles were able to take advantage of that matchup frequently, so I won’t belabor the “Why won’t you run the ball?” point. But the Patriots were also deficient against the run, no matter what Reid said in his post game press conference. Especially in a game when the goal needed to be keeping Tom Brady off the field, McCoy should have been more of a factor. You can bet that’s what Jim Washburn was heckling Marty Mornhinweg about on the sideline.

.125 = Eagles win percentage at Lincoln Financial Field since Week 16 of last season. Seeing so many fans stream out of the stadium with a quarter left to play can’t have made Jeff Lurie happy.

Photo from Getty.

On DeSean Jackson and the Maturity Question

DeSean Jackson Eagles Maturity

DeSean Jackson is a smart, mature man. I know this because Jackson had little trouble learning the NFL routes and starting in his rookie year. I know this because he’s done stand-up work against bullying. I know this because of his pitch-perfect ironic delivery during his turn selling jerseys at Modell’s.

Moreover, I know Jackson is savvy and levelheaded because he has learned from the mistakes of wide receivers past and hasn’t gone to the media with his contract issues. Knowing that keeping his mouth shut can only help negotiations isn’t a difficult concept to understand, but carrying it out when he is in front of the media constantly requires tremendous discipline.

Yet despite all of this evidence, DeSean confounds his fans by continuing to commit absolutely bonehead mistakes on and off the field. There were his goal line celebrations, parts one, two, and three — that threatened to overwhelm the actual events. More recently, Jackson’ directed gay slurs at a rude caller during an appearance on the radio.

I’m not entirely sure how to reconcile these two persona, although I don’t think (as some do) that DeSean’s public character is simply an act. That’s silly and overwrought.

Rather, I think a more likely explanation is that Jackson is simply a 24 year-old kid who still has a hard time balancing and moderating his burgeoning stardom. When he commits the time and energy to doing something the right way, he manages to be a role model as a hard working athlete, an effective community service leader, and a responsible actor in his NFL business dealings.

Paradoxically, it is his quickness that often seems to get him into trouble. DeSean’s feet and tongue tend to run a little bit ahead of his brain, and his fans suffer an uneasy twinge each time he lets a moment get away from him. Hopefully Jackson will grow out of it while he still has that one-of-a-kind speed left to burn.

Photo from Getty.

A Super Bowl Indicator: Net TD Efficiency

Aaron Rodgers Green Bay Super Bowl Touchdown

In the last post we ranked NFL offenses according to their touchdown efficiency per plays, yards, and drives. Eliminating field goals and calculating rankings based on efficiency rather than raw scores helped isolate the best and worst offenses.

So for the next step, we’ll add defense. I added up touchdowns allowed by each defense and figured out the same efficiency stats as yesterday. Then, simple enough, I subtracted defense from offense. Positive scores indicate better teams. For example, the New England Patriots make their opponents go 13 extra plays, 64 extra yards, and 2 extra drives to get a touchdown. They are ranked third overall.

First and second, by a solid margin, go to the two Super Bowl teams. They were 1-2 in every category, and outpaced the third place teams significantly in Net Plays per TD and Net Drives per TD. Predictive stats are often too reductive, but if you used this measurement to pick the Super Bowl teams at the end of the regular season — it would have guided you well.

The Eagles, despite their highly ranked offense, come out only 13th in the net rankings. If you didn’t figure it out already, Sean McDermott’s defense was a huge liability in 2010. Also note that while we’ve eliminated some biases, the stat doesn’t account for strength of schedule. Not sure how much that would change things, but keep it in mind nonetheless.

See the full rankings below.

2010 Net Touchdown Efficiency Ranking

Photo from Getty.

Ranking NFL Offenses by Touchdown Efficiency

Michael Vick NFL Touchdowns

Yesterday we saw how offensive touchdowns are much more important for success than field goals. But let’s not stop there.

If touchdowns are important, it’s not enough to just rank teams by the number of touchdowns. Some teams have more opportunities or have worse field position. Instead of just counting overall touchdowns, we can weight them by how many yards, plays, or drives each team needs to get one.

With that in mind, I calculated touchdowns scored per all three factors in the 2010 season. Each measures something slightly different. For example, the Eagles were 8th in Yards per TD, 5th in Plays per TD, and 7th in Drives per TD. Fairly close, but the best showing in Plays per TD probably reflects the huge number of big plays and long touchdown catches last year.

Below you’ll find the full chart of all NFL teams, best offense to least according to the average rank of these three measurements. It likely gives a more accurate picture of the best and worst offenses than any ranking that accounted for field goals or other methods of scoring.

2010 Offensive Touchdown Ranking

Tomorrow we’ll bring the ranking one final step further.

Photo from Getty.

Why Field Goals are Largely Inconsequential

David Akers NFL Field Goals

How do we rank offenses? Total yards gained? Total points scored? Those numbers aren’t nearly as helpful as we might think.

Not all points are created equal. Touchdowns are better than field goals. Some times have more opportunities or better field position than others. We can’t completely eliminate those biases, but we can try.

Let’s start today with touchdowns and field goals. How are they related? Do great offenses score more of both, since they make it down the field more? Do worse offenses, stalling in the red zone, turn to field goals as a replacement for touchdowns? Both would make sense, but neither is correct.

2010 NFL Scoring by Team Field Goals Touchdowns
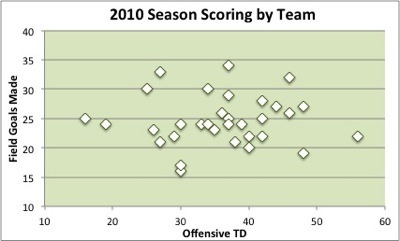
Look at the graph at right. There is simply no correlation, positive or negative, between touchdowns and field goals.

And that’s not the only thing we can learn. The difference between the team in 2010 with the most field foals (Oakland) and the team with the least (Buffalo) was 18 — or 3.4 points per game. Having an extra field goal a game sounds like a path to victory, but notice that the Raiders, as league leader, weren’t exactly taking the NFL by storm. On the flip side, the difference between the most offensive touchdowns (New England) and the least (Carolina) was 40 — a whopping 17.5 points per game including extra points.

It might seem like a cliche of conventional wisdom, but touchdowns are the difference maker. Everyone’s going to hit about the same number of field goals by the end of the season — teams are within 3.4 points per game of each other there. The key is to get into the end zone.

Perhaps not a revolutionary conclusion, but we’ll take this a step further tomorrow.

Photo from Getty.