• Blog
  • About
  • Links
  • Contact
  • Twitter→

McNabb or Kolb

  • Blog
  • About
  • Links
  • Contact
  • Twitter→
121315_cox-happy_1200.jpg

Can't Run On Us

121315_cox-happy_1200.jpg

The following is a guest post by @sunset_shazz.

As the inimitable Jimmy Kempski recently explained, the Eagles’ defensive game plan is rather simple:

  1. Stop the run.
  2. Make the opposing offense one-dimensional.
  3. Get after the quarterback.

Indeed, Eagles opponents do appear to give up on the run – this year the defense has faced the fewest rushing attempts per game. One caveat: they also have the second-highest point-differential. As everyone knows, you face fewer run attempts when holding a lead.

Are the Eagles’ opponents giving up on the run because they’ve fallen behind? Or are the Eagles facing fewer rush attempts due to their stout run defense, irrespective of the scoreboard?

I examined Game Script data compiled by Chase Stuart. Game Script is basically the average score margin over a total game. As a stylized example, let’s say Team A returns the opening kickoff for a touchdown, kicks the extra point, then neither team scores for the rest of the game. Team A’s Game Script in this simplified example would be +7 (the average lead held the entire game); Team B’s Game Script would be -7. A higher game script is often associated with more rushing by the team who’s leading (because you run when you win, not win when you run) and more passing by the opposing team (which has a negative game script).

The plot below shows each team’s average Game Script on the X-axis and average Pass/Run Ratio on the Y axis (all data through weeks 1-10). The regression line represents the expected Pass/Run Ratio, given Game Script, computed from the 146 games that were played through week nine. [1] A team that is toward the right (LAR, PHI) has enjoyed a higher average lead, and a team toward the top (SFO) has a higher pass/run ratio.

By comparing each team’s pass-run ratio to what one would theoretically expect given game situation (denoted by the regression line above), one may construct a “Pass Heavy Index”:

This year, Bill Belichick has been 10.9% more likely to call a pass, given game situation, than average. With Mitchell Trubisky behind center, John Fox is 15.5% less likely to call a pass, given game situation, than average. Despite almost being run out of town after a week 2 game in which his Pass Heavy Index was +27%, Pederson is basically in the middle of the pack.

What about the defense? One may similarly plot each team’s opponent’s average pass/run ratio against the opponent’s average game script:

Did you notice the outlier on the upper left? One may also compute each team’s opponents’ Pass Heavy Index:

The table above shows that Eagles opponents are not only passing more than any other team’s opponents (70.1% of the time), but that they are the most pass heavy adjusted for game situation. The evidence supports Kempski’s thesis: Eagles opponents this year have become one dimensional. One way to look at it is that opponents have a healthy respect for the Birds’ run defense. Another way to view it: they think they can attack the secondary. Somebody please inform the Green Goblin that he’s being disrespected.

Stick Figure GIF reprinted with permission, courtesy Jimmy Kempski

Alternatively, perhaps this is an artifact of sampling bias – maybe the Eagles just happen to have faced teams who pass a lot (like Arizona).

Looking at it game-by-game, 6 out of 9 teams the Eagles played chose to pass more than they typically do, adjusted for game situation. There were three exceptions: the Cardinals 76.7% pass ratio, though 8.3% higher than expected, was a tad (0.5%) less pass heavy than Bruce Arians’ typical game; this was due to an extreme game script driven by a three touchdown first quarter by Carson Wentz. In the most recent two weeks, the Niners and Broncos both continued to run more than would be expected, despite falling behind by two scores in game script. Could this portend a change in opponent strategy, perhaps due to the absence of LB Jordan Hicks, whose season ended in the first series of Week 7? Or was this merely due to the injury to Joe Staley for the Niners  and the move to Brock Osweiler for the Broncos? The next few weeks should be interesting.

The analysis presented above demonstrates that Eagles opponents are 10% less likely to run the ball than average, given the game situation. If opponents indeed are choosing to attack the Eagles’ passing defense, they are picking a different, though still potent, poison. The Eagles passing defense is ranked 7th in ANY/A allowed, and ranked 8th in defensive passing DVOA.

Interestingly, the Rams’ and Jaguars’ average lead has been similar to the Eagles’, though their opponents are running more than typical, given such a deficit. Those teams are ranked 2nd and 1st against the pass, respectively, in DVOA, and are ranked 15th and 30th against the run. Though opponents of each team are falling behind during games at a similar rate, they are choosing to attack the Eagles differently, given the relative strengths of their defensive units.

Thanks to Eagles fan Noah Becker and MoK Editor-in-Chief Brian Solomon for discussion leading to this post. 

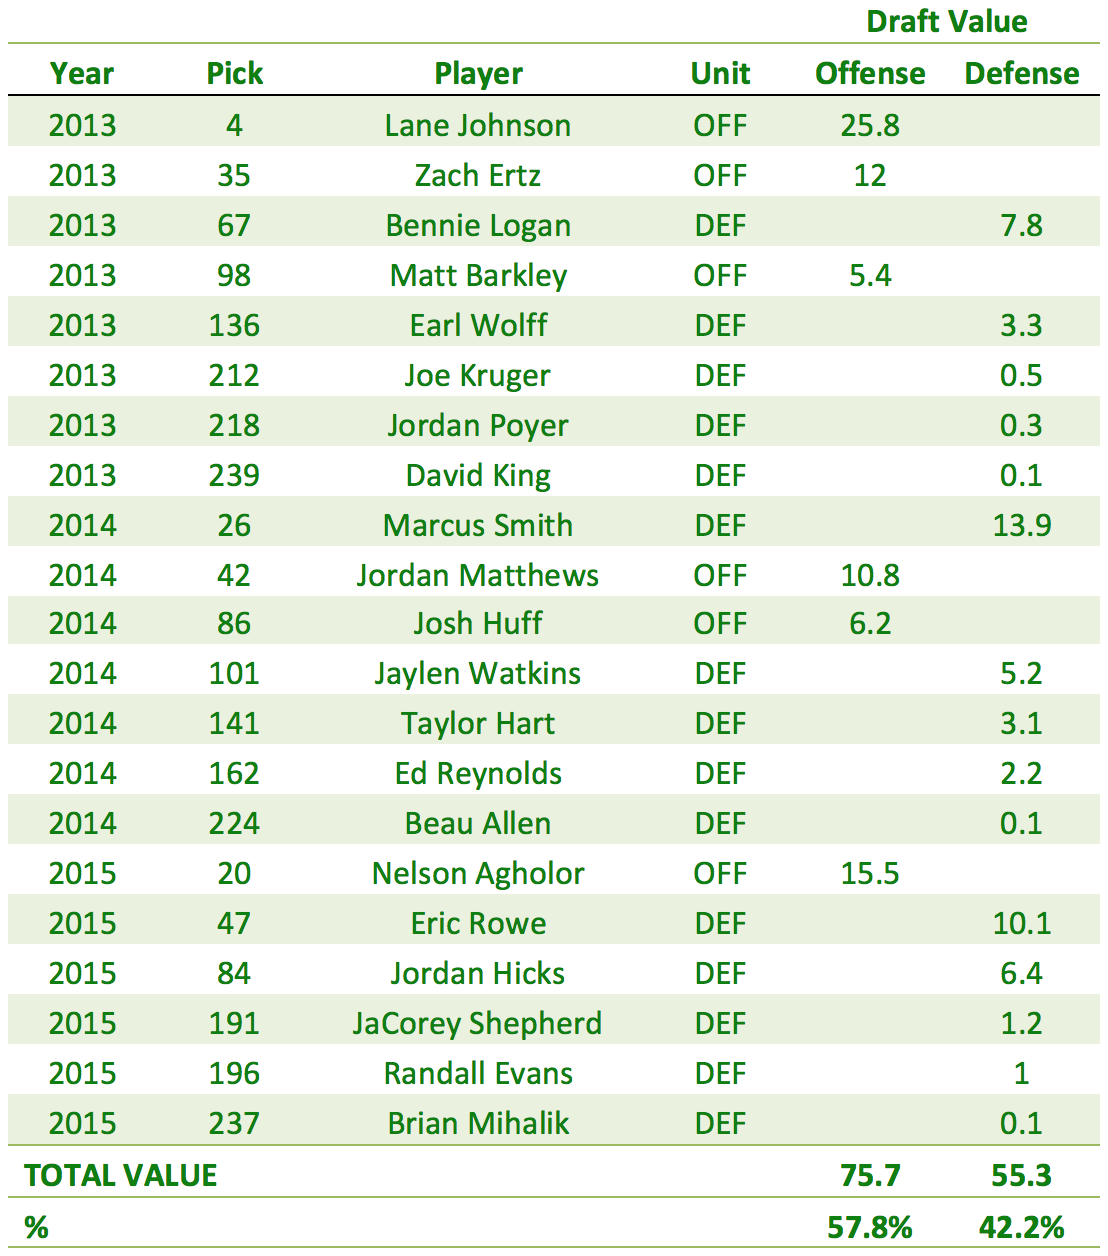
[1] The Y-intercept indicates the neutral pass/run ratio, 57.8%, which also mathematically corresponds to the league average pass-run ratio.

Tagged with 2017, Run Defense, Defense, Statistics, Chase Stuart, Jalen Mills, Jimmy Kempski, Philadelphia Eagles.

November 18, 2017 by Brian Solomon.
  • November 18, 2017
  • Brian Solomon
  • 2017
  • Run Defense
  • Defense
  • Statistics
  • Chase Stuart
  • Jalen Mills
  • Jimmy Kempski
  • Philadelphia Eagles
  • Post a comment
Comment
usa_today_9781843.0.jpg

The Kids Are Alright

usa_today_9781843.0.jpg

The following is a guest post by @sunset_shazz.

Carson Wentz’s start to the 2017 season has garnered national plaudits for his stewardship of the Eagles’ league-leading offense. But it being 2017, there lurks a coterie of skeptics who claim his underlying ability is “horrendous” like Blake Bortles or merely pedestrian like Andy Dalton. Even more emphatically, poor Jared Goff was confidently pronounced a bust after one season.

Is it fair to judge a quarterback solely on his rookie year? What about after the first nine weeks of his second season in the league? And how might one systematically evaluate a developing quarterback, relative to historical data?

Let us consider some advanced metrics that are used to evaluate quarterbacks:

  • Adjusted Net Yards / Attempt (ANY/A) was developed by the great Chase Stuart, and accounts for sack yards, while providing a bonus for touchdowns and a penalty for interceptions. Both Stuart and Topher Doll have shown that ANY/A predicts wins. Danny Tuccitto has brilliantly used confirmatory factor analysis to show that ANY/A is a stable indicator of QB quality.
  • Defense-adjusted Value over Average (DVOA), the brainchild of Aaron Schatz at Football Outsiders, is a success-based, opponent-adjusted per-play efficiency metric intended to both correlate with non-opponent adjusted wins (descriptive) and to predict future opponent-adjusted wins.
  • Defense-adjusted Yards above Replacement (DYAR) uses similar success-rate inputs to DVOA, in order to compute an aggregate value for a player (combining volume and efficiency).
  • Total QBR is ESPN Stats & Information’s proprietary efficiency metric that combines both passing and running contributions, adjusted for game situation, with charting to assign responsibility to a quarterback’s receivers and blockers.

Through nine weeks, the 2017 sophomore class is playing at an extraordinarily high level, as measured by each of these advanced stats:

Please note that nothing herein intends to argue for any of these quarterbacks to the detriment of the others. Though the data presented above is insufficiently precise to draw ordinal rankings, it is unequivocal:

Wentz is good. Goff is good. Prescott is good. All three of these things can simultaneously be true, pace internet trolls.

Some epistemic humility is in order: the first-nine-week sample size is obviously noisy, with varying degrees of luck, opponent quality, team injuries, coaching quality and supporting casts influencing the statistical performance of each QB. Danny Tuccitto warns us that ANY/A stabilizes at 326 dropbacks, and even at that sample size, 50% of the observation represents randomness/luck. Nonetheless, the broad takeaway should be that each sophomore QB has thus far performed at a top-quartile level, judged by a variety of different metrics. Is this good? And how confident can we be that such performance will continue?

Recently, Chase Stuart noted that three sophomores from the same class have not played this well since at least the NFL-AFL merger. Though ANY/A is less context-specific than the other measures, it has the advantage of being transparent and easy to calculate, permitting historical analysis. Stuart compared the first 8 weeks of 2017 for Goff, Prescott and Wentz to full seasons of prior 2nd year QBs. Comparing partial to full seasons isn’t quite neutral, due to the disparity in number of games sampled; we should expect some mean reversion of our reference QBs as sample size increases. Using pro-football-reference’s excellent query engine, I examined the first 9 weeks for each sophomore quarterback from 1999 through 2017. Historical comparisons need to be adjusted for era, due to the enormous change in average NFL passing efficiency over time. To account for this, I divided each quarterback’s ANY/A by the league average for that year. [1]

Top ANY/A vs Average since 1999, sophomore QBs, weeks 1-9

The 76 QB sample set in this study is itself a product of survivorship bias: only those QBs who were successful enough to throw 100 passes in the first 9 weeks of their second year in the league are included. On the other side of the distribution, successful QBs who rode the pine for their first few years (like Aaron Rodgers, Tony Romo or Philip Rivers) are not in this sample. The average age of the sample is 24, similar to our reference QBs.

The three 2017 sophomores are, as Stuart observed, performing extraordinarily well relative to their peer set (all are in the top quartile of the sample). Relative to their era, they are passing with greater efficiency than Tom Brady, Drew Brees, Matt Ryan or Andrew Luck did in their second seasons.

You will also note that the top ranked sophomore QBs include many future hits (Big Ben, Kurt Warner, P. Manning) and a few notable misses (Nick Foles, Derek Anderson). The last column I included is the Career Approximate Value (CAV), which is a (very) rough method developed by Doug Drinen that puts a single number on a player’s total career, encompassing both longevity and performance.

Below, I plotted log Career Approximate Value against ANY/A relative to league average for the first 9 weeks for second year QBs from 1999-2015 (I excluded QBs from 2016-2017 because recent QBs have not yet had sufficient time to accumulate CAV points).

The positive relationship shown above indicates that the first 9 weeks of a sophomore season predicts 37% of a QB’s future CAV. Do note that the correlation is sensitive to a few outliers. The odious Ryan Leaf and Akili Smith are on the bottom left, whereas Foles and Anderson are on the bottom right. I don’t want to ascribe an illusion of precision to this rough analysis – don’t fixate on the exact R-squared number, or the model coefficients. Both sample size and the extremely imprecise nature of CAV make me hesitant to draw definitive conclusions from the data. What is interesting to me is that the same plot using a QB’s full rookie season yields an R-squared of 0.224 – in other words, the first 9 weeks of a QB’s sophomore season tells you roughly 70% more about his future career than his entire rookie season does. Extending this analysis to full seasons since 1970, the R-squared is 0.083 and 0.2348 for rookie and sophomore years, respectively (n=155 & 204). My interpretation of this data: though rookie and second year passing efficiency predict only a small fraction of a quarterback’s career value, the sophomore year deserves 2.8x as much weight as the rookie year, in terms of confidence about predictive power. Rookie performance, in particular, is extremely noisy. One would have been wise to heavily discount Troy Aikman, Donovan McNabb and Terry Bradshaw’s dreadful rookie seasons. Rams fans should take note.

Relatedly, I didn’t find any predictive power when measuring the degree of era-adjusted-ANY/A improvement from rookie to sophomore season. This echoes Vincent Verhei’s study of second year improvement using DVOA. In hypothesis testing, a negative result can be an interesting result.

Quantitative analysis is not the only tool in an NFL researcher’s kit. Film study (though not my sphere of competence) is also valuable. Though Nick Foles had a magical sophomore season, the film showed reason for concern, as my friend Derek Sarley noted. I don’t personally see similar issues with Wentz – both his pre-snap adjustments and post-snap play appear to pass the “eye test”. No, he’s not perfect. Yes, he has flaws he needs to address. But so do all second year quarterbacks.

Moreover, our penchant for treating quarterbacks as static vessels of talent/ability shortchanges the importance of coaching and development. The installation of a new coaching regime in Los Angeles appears to be an interesting natural experiment, in terms of Goff’s maturation. Similarly, we can view Ezekiel Elliott’s probable(?) suspension as an instrumental variable when evaluating Prescott.

All inductive statements are, by their very nature, revisable. We don’t know the future; we can only use informed judgment to hazard a prediction. The false-positive rate for the top 20 QBs in table 2 above is 25% by my count [2], so let’s take that as the “base rate” of failure for the 2016 Sophomore QBs. It is therefore reasonable to expect that two – perhaps all three – of the 2016 sophomores will enjoy successful careers as NFL starters.

Finally, in these impatient times, let us remind ourselves that transcendent quarterbacks do not emerge, fully formed, from the forehead of Zeus. Each of these young, relatively inexperienced quarterbacks is playing the most technically and cognitively demanding position in sports at a very high level. Adjusted for experience and era, their achievements are even more astounding. The evidence suggests that the future of quarterback play is bright. Football fans, rejoice.

Thanks to Eagles fan / Data Scientist Sean J. Taylor for his insightful discussion on methodology. Any errors are mine alone.

[1] PFR’s partial season engine shows results from 1999 onward. Full season results go back before the merger, and also generate an era-adjusted ANY/A+ which uses a “Z-score” methodology, expressed in standard deviations above or below the population mean. My method is less sophisticated, though nonetheless robust.

[2] I excluded the reference QBs, as well as Marcus Mariota.

@sunset_shazz is an Eagles fan who lives in Marin County, California. He previously wrote about 4th down decisions.

Tagged with 2017, Carson Wentz, Dak Prescott, Jared Goff, Quarterback, Statistics, Rookie.

November 11, 2017 by Brian Solomon.
  • November 11, 2017
  • Brian Solomon
  • 2017
  • Carson Wentz
  • Dak Prescott
  • Jared Goff
  • Quarterback
  • Statistics
  • Rookie
  • Post a comment
Comment
Doug-Pederson.jpg

Think Again About Fourth Downs

Doug-Pederson.jpg

The following is a guest post by @sunset_shazz.

With their NFL team celebrating a come-from-behind victory capped by a last-second, team-record 61-yard field goal by an unheralded rookie kicker, all of Philadelphia is understandably basking in reflected glory.

Just kidding.

Instead, the city is fulminating in collective outrage over Doug Pederson’s decision to eschew punting on 4th and 8 from the opponent’s 43-yard line, with 2:36 left in the 1st half and a 7-point lead. Numerate commentators Bo Wulf and Jimmy Kempski have demonstrated that Pederson’s decision was by no means incorrect (most likely it was a push). The case for more aggressive fourth down decisions is over a decade old; there is meagre profit in arguing with those who are impervious to evidence.

I am far more intrigued by the decision process itself. Sheil Kapadia quotes Jeffrey Lurie discussing the 4th down decision-making process, unprompted, in an informal chat with reporters after a recent presser:

“A lot of teams — our’s is one — where it’s all in the offseason done with mathematics,” Lurie said. “It’s not based on any form of instinct. If it’s going to be 50/50, 48/52, then a coach is going to have their instinctual predilection, right? But what we found is there’s been so many decisions over time that are too conservative for the odds of maximizing your chance to win that the opportunity. … I mean, you’ve seen certain coaches that are deemed more aggressive because the math leads them there. That’s all it is.”

Following some snickering that Pederson’s decision-making is being dictated by his superiors, the head coach clarified that he is the decider, with help from an analytics staff, including coaching assistant/linebackers coach Ryan Paganetti and Jon Ferrari (the latter’s title – “director of football compliance” – was obviously conceived by Oceania’s Ministry of Truth).

Is this decision-making set up weird? No, in fact it may be ideal.

I was struck how Pederson, during a press conference, corrected a reporter’s estimate of the historical probability of success (the “base rate”), citing his staff’s model estimate off the top of his head. His facility of recall regarding the base rate is textbook behavioral science. The seminal work of Daniel Kahneman and Amos Tversky showed that what they termed “base rate neglect” is common in poor decision making. Here is an example from Kahneman’s Thinking, Fast and Slow:

An individual has been described by a neighbor as follows: “Steve is very shy and withdrawn, invariably helpful but with little interest in people or in the world reality. A meek and tidy soul he has a need for order and structure, and a passion for detail.” Is Steve more likely to be a librarian or a farmer?

As Kahneman wryly notes, it helps to know that there are roughly 20x more male farmers than male librarians in the United States. The base rate is very important information in making the right judgment.

I am struck by Pederson’s description of how he receives base rate and other key information, immediately prior to making an informed judgment in which he also will take non-quantitative measures into account (e.g. how the defense is playing, the weather, injuries, etc.) Here, the Eagles are harnessing another key behavioral tic – anchoring bias. Anchoring is the tendency to overweight proximate (sometimes irrelevant) information that is the starting point in making a decision under conditions of uncertainty.

Again, Kahneman and Tversky were among the first to describe and investigate anchoring, and by 2017 there exists a vast academic literature on it. My favorite study was conducted by James Montier, a financial economist (full disclosure: also a former colleague). Montier asked hundreds of subjects [1] (mainly fund managers and financial analysts) the following:

1) Please write down the last four digits of your telephone number
2) Is the number of physicians in London higher or lower than this number?
3) What is your best guess as to the number of physicians in London?

Montier loves shocking people with his results:

[T]hose with telephone numbers above 7000 believe there are on average just over 8000 doctors. Those with telephone numbers below 3000 think [there] are around 4000 doctors. This represents a very clear difference of opinion driven by the fact that investors are using their telephone numbers, albeit subconsciously, as inputs into their forecast.

Clearly, one’s personal telephone number should have no bearing on one’s estimate of the number of physicians in London. The fact that it does, consistently, for intelligent, educated, statistically-minded professionals speaks to the power of anchoring bias.

Over the last decade, hedge funds have paid attention to the behavioral science literature, and have sought to anchor their professionals to salient, predictive data. This has driven hybrid-quantitative trading strategies where a fund manager is augmented by an algorithmic or otherwise quantitative model. The outputs of the model are then used as anchors for further tweaking by a human that is aware of variables outside the model’s specification. Wall Street got this idea, in part, from the world of chess, where, by 2005 the best type of player was a hybrid expert + model, capable of beating Grandmasters and machines. Similarly, University of Pennsylvania professor Philip Tetlock [2] has found that expert forecasters can significantly improve their decision processes by relying on models to improve their calibration of variables such as base rates. The Intelligence Advanced Research Projects Activity (IARPA) has taken note of these results, and the CIA has been studying similar literature since 1999.

When Doug Pederson hears base rate data and associated variables over his headset, the Eagles organization is harnessing anchoring bias, and turning it from a bug into a feature. Moreover, the augmented expert approach is consistent with that of the more sophisticated analysts in the fields of finance, academia, chess, and government.

It’s nice to root for a team that pays attention to the world outside sports, rather than snickering at it dismissively.

@sunset_shazz is an Eagles fan who lives in Marin County, California. Check out his previous article during last year's Air Yards debate.

[1] His initial sample was 300 subjects, though I believe he has replicated this finding with subsequent samples.

[2] Since 2012, I have been a participant in Tetlock’s Good Judgment Project.

Tagged with Doug Pederson, Fourth Down, 2017, Jeffrey Lurie.

September 28, 2017 by Brian Solomon.
  • September 28, 2017
  • Brian Solomon
  • Doug Pederson
  • Fourth Down
  • 2017
  • Jeffrey Lurie
  • 3 Comments
3 Comments

The Eagles Aren't Good Enough To Make Mistakes

Despite disappointing results in the last two games, the Eagles are a good football team. Going into this week, they were first in the NFL in point differential and second in DVOA. Now, they remain third-best in the former and should stay near the top in the latter.

Two losses, by a combined score of eight points, do not end the season. But they do show us what kind of team the Eagles are: one that can't afford to make mistakes if they want to compete for the division title. 

The truth is that the Eagles don't have many difference-making players. Fletcher Cox and (old but still great) Jason Peters, perhaps. After those two, who can the team count on to consistently win individual match-ups? Carson Wentz has flashes of brilliance. Third down back extraordinaire Darren Sproles is the only explosive play maker on offense.

This roster isn't built to exploit mismatches in talent. It's built on competence. On defense, guys like Brandon Graham, Jordan Hicks, and Malcolm Jenkins form the core, but none of them are keeping offensive coordinators up at night trying to scheme around them. They are good because they do the right thing (most of the time). They won't get you killed and they can succeed within the scheme. Ditto on offense: Jordan Matthews and Zach Ertz are solid starters in the NFL as long as you're not counting on them to be the number one option.

The early season win streak was built on competence in all phases. The defense didn't do anything special with fancy blitzes; it just lined up and got pressure with four rushers. The offense took league-best field position and converted drives into points at the second-highest rate. They did so methodically, not gashing teams with big plays but marching down the field with a mix of efficient runs and short passes (part of the reason Carson Wentz scores so low in Air Yards). Limiting turnovers (to zero for the first three games) and capitalizing on opponent mistakes.

That strategy was effective until this started happening:

As far as I can tell, weeks five and six are the most penalties the Eagles have committed in consecutive weeks since 1989. And those penalties matter. According to friend of the blog Sean Taylor, each additional penalty a team has over its opponent is worth approximately -0.5 points. The Eagles have out-fouled their opponents by 16 in the last two weeks and, surprise, lost by a combined eight points. Add in a couple more unforced errors, like a rookie fifth round pick stumbling out of the gate and a veteran running back fumbling at the worst possible time, and you can see how the Eagles went from 3-0 to 3-2.

Again, this is not to bury them. They are still a good team that should be at least in the race all season. But it's not like teams we've seen in years past that could spot an opponent a three touchdown lead and roar back in the final minutes. There are too few #playmakers and not enough strengths. That means they either have to return to the suffocating competence of the early season—limiting turnovers and penalties, staying efficient on offense, and preventing big plays on defense—or come up with a new way to win... like putting more in Wentz's seemingly-capable hands.

Tagged with Philadelphia Eagles, 2016, Carson Wentz, Doug Pederson, Penalties, Playmakers, Jordan Matthews, Zach Ertz, Fletcher Cox, Darren Sproles, Brandon Graham, Jordan Hicks, Malcolm Jenkins.

October 17, 2016 by Brian Solomon.
  • October 17, 2016
  • Brian Solomon
  • Philadelphia Eagles
  • 2016
  • Carson Wentz
  • Doug Pederson
  • Penalties
  • Playmakers
  • Jordan Matthews
  • Zach Ertz
  • Fletcher Cox
  • Darren Sproles
  • Brandon Graham
  • Jordan Hicks
  • Malcolm Jenkins
  • Post a comment
Comment

Time To Clear The Air

The following is a guest post by @sunset_shazz.

This is a wonderful time to be an Eagles fan. Jim Schwartz’s Attack Nine defense is rapidly exorcizing the ghost of Juan Castillo. Doug Pederson has rejuvenated an offense that had become stale and predictable under Chip Kelly. And, of course, rookie quarterback Carson Wentz is turning heads across the league, not to mention in the oval office.

Eagles fans, unexpectedly blessed with success, look to the poet Browning to give voice to their collective sentiment:

The lark's on the wing; 
The snail's on the thorn: 
God's in His heaven— 
All's right with the world!

But wait. From his perch at the indispensable Football Outsiders, Scott Kacsmar has some discomfiting news: both Wentz and Cowboys rookie QB Dak Prescott are mere dink and dunkers, with lower than average air yards per attempt (defined as the average distance a football is thrown beyond the line of scrimmage). A low score on this metric is undesirable, in Kacsmar’s view.

The inimitable Jimmy Kempski responded to Kacsmar’s initial claim with a sardonic video rewind post, prompting Kacsmar, in an entertainingly vitriolic rant, to frame this argument as a contest between enlightened, statistically rigorous analysts on one side and straw-manning “numbers are for nerds” egg avatars on the other.

I don’t believe that view is correct.

As Brian Burke has explained:

A statistic that both correlates with winning and correlates with itself would be a reliable predictor of future wins.

First, you want your in-sample measure to have some predictive power in estimating out-of-sample future wins, because, hello, you play to win the game. Second, you want a metric to have some degree of statistical persistence over time, in order to be confident you are measuring a signal (in this case, an attribute of quality quarterbacking) rather than mere noise.

Regarding the latter, Kacsmar notes that in 2015, the correlation between air yards in the first three weeks of the year and the air yards for the entire season was 0.80. Well, that doesn’t seem quite fair, does it? After all, what we really care about is the correlation between the first 3 weeks of the season and the ensuing 14 weeks. Using his dataset, and using the Spearman rank correlation estimator rather than a standard Pearson estimator, which in this case would be considered less robust, I found that the correlation between the first 3 weeks and ensuing 14 weeks last year was 0.60. That’s pretty good, as far as football statistics go. However, do note that within a season a number of other factors surrounding the quarterback are, for the most part, held relatively constant: coaching scheme, strength of running game, defensive strength, etc.

When Chase Stuart examined the persistence of the Air Yards metric from year to year, he found that between 2006 and 2012 for 100 qualifying QBs the correlation between Year N and Year N+1 for Air Yards was 0.34. Both completion percentage and yards/attempt were “stickier” with N to N+1 correlations of 0.51.

Kacsmar, in his FO piece, assembles a smaller dataset (than Stuart, above) which he judges to be salient:

I gathered that yearly data on 21 quarterbacks with at least four years of starting experience, all of whom are still active starters this year except for the retired Peyton Manning. The following table shows their average air yards by year for the period of 2006 to 2015.

The first rule of Analytics Club is to plot your data, so I plotted Kacsmar’s data into a time series chart, in order to visualize the range and variability of the attribute, segregated by quarterback, over time:

Taking Kacsmar’s dataset (which, it is important to note, uses 21 quarterbacks who have experienced some career longevity rather than Stuart’s more comprehensive analysis of 100 QBs), and running a similar autocorrelative N to N+1 analysis, I found that the year-to-year correlation was 0.40. My friend, real-life data scientist Dr. Sean J. Taylor, was generous enough to both replicate my work and provide me with a scatterplot, complete with line of best fit and confidence interval shading:

Chart courtesy Sean J. Taylor

Chart courtesy Sean J. Taylor

The autocorrelation statistic, the scatterplot and time series visuals each show the same thing: we are measuring mostly noise, with a faintly detectable QB signal. The attributes I mentioned before—scheme, effectiveness of the running game, defensive efficiency which affects game script—are all likely to change the calculus of decision-making with regard to throwing shallow or deep.

In fact, Kacsmar himself gives us a good reason to doubt the validity of Air Yards in capturing an attribute of QB quality: it doesn’t improve as a player gains more experience. Quarterbacks, like all athletes, typically experience an age curve, reflecting both athletic maturation and decline, as well as the steep learning curve imposed by formidable NFL defenses. Chase Stuart has shown that the age curve for NFL quarterbacks is pronounced. The absence of an “age/experience curve” for Air Yards is yet another red flag.

Air Yards doesn’t appear to measure a persistent quarterback attribute over time, particularly when compared with a conventional statistic such as completion percentage or advanced statistics such as Adjusted Net Yards / Attempt (ANY/A, for which Danny Tuccitto brilliantly used confirmatory factor analysis to verify its validity) or Defensive Yards Above Replacement (DYAR, rigorously developed and tested by Aaron Schatz).

But does it predict wins?

My general model of the production function of football is as follows: runs and passes are inputs; completions and first downs are intermediate goods; points are outputs. Success rate metrics such as Defensive-Adjusted Value Over Average (DVOA), DYAR, and ANY/A are all measures of intermediate goods which are of interest to the analyst because they tend to reliably convert to points. And as Chip reminds us, if you (f__king) score points you are more likely to win. 

Chart courtesy Sean J. Taylor

Chart courtesy Sean J. Taylor

The scatterplot above shows the relationship between a QB’s average air yards over a season and the points scored by his team over that season. There is no statistically significant relationship between the two measures. Contrast this with ANY/A, which correlates 0.55 with wins. Or DYAR & DVOA, whose parameters were specified in order to predict future wins.

Kacsmar has been careful to note that he isn’t an advocate of maximizing Air Yards; he thinks middle is best. He elaborates in his FO piece:

Generally, air yards are a stat where you don't want to rank at the bottom, because that is where many ineffective passers dwell, including Blaine Gabbert. That preference for short throws often extends to crucial downs, which is why these quarterbacks tend to do poorly in ALEX and attacking the sticks. However, it is not preferable to rank at the very top in air yards either, because that is how "screw it, I'm going deep" players such as Michael Vick, Tim Tebow, Vince Young and Rex Grossman have earned their reputation as inefficient passers.

His claim, if I have understood it correctly, is that quarterbacks at the tails of the distribution are less likely to be successful in future. Our scatterplot above doesn’t show any relationship between the middle of the distribution and success, measured by points scored. But could Kacsmar’s anecdotal observation that “middle is best” be a mere artifact of sampling? If successful quarterbacks have longer careers, the law of large numbers dictates that they will, by mere virtue of larger samples, be less prone to the extremes in Air Yards. Taking a separate dataset evaluating quarterback air yards between 1992 and 2012, and plotting those against passes thrown, one arrives at the following:

You can see that the more passes a given quarterback throws, the less variance he exhibits with respect to his peer cohort. This needs to be examined further, in my view. I admit that I am not familiar with the nuances surrounding various measures of air yards (various observers have different estimates), but a longer, broader dataset would be desirable to plot air yards versus attempts. We don’t want to fall prey to the famous Bill and Melinda Gates Foundation misstep where it was initially claimed that small schools are consistently among the best performing schools, when it was merely the case that small schools experience more variance than larger schools, and therefore disproportionately comprise the tails of the distribution.

Here is the plot of the fourth-grade math scores versus number of students in the school:

The prior two sections showed that Air Yards as a measure is neither statistically persistent nor predictive of success, in terms of points scored. I did mention some alternative, robust metrics, two of which are generated by Football Outsiders. As of Week 3, FO has not applied opponent adjustments to their measures. On a raw Value Over Average and Yards Above Replacement measure, these young QBs have performed in the top quartile over the first 3 games.

Looking merely in the rearview mirror, without making any judgments about the future, they appear to have performed well.

Another measure I have mentioned, Adjusted Net Yards / Attempt (the “adjustment” gives a bonus for touchdowns and a penalty for interceptions, and the “net” deducts sack yards) is a persistent, predictive measure. With a hat tip to the excellent Derek Sarley, I prefer to plot this against completion %, to show both efficiency and consistency of per-play execution (weeks 1-3, minimum 46 attempts):

Once again, the rookies have played impressively: Wentz and Prescott are in the top quartile (4th and 8th, respectively) in ANY/A and the 2nd quartile (13th and 10th, respectively) in completion %.

As Bill Barnwell has noted, the statistics from 3 games tell us very little about how a QB will play in the future. A very small sample size disadvantages a purely statistical analysis; the comparative advantage shifts towards the film analyst. Ideally, one would combine both, but in this case, the stats aren’t meaningfully more robust than mere anecdotes. This is why I disagree with Kacsmar’s adversarial Michael Lewis-style “stats versus scouts” framing; the NFL stats on these two rookies don’t really tell you anything dispositive yet. From a purely Bayesian perspective, the eye test is just as likely as a mere three weeks of quantitative data to meaningfully update one’s priors. I have not yet enjoyed the privilege of watching Prescott, but I’ve seen every Wentz throw; moreover, I’ve seen astute film analysts such as Greg Cosell, Fran Duffy, Jimmy Kempski and Ryan from ChipWagon break his film down. Lastly, as Brent from EaglesRewind notes, one’s priors should be heavily influenced by draft position, which was the NFL auction market’s initial “revealed preference” view of value.

As for me, I’m on the Wentz Wagon. Dan McQuade reasons persuasively that Eagles fans should enjoy this run, because life is fleeting. Memento mori, football fans.

TL;DR:

  • The early results from the credible advanced statistics, meaning those that tend to be both persistent and predictive, are that Wentz and Prescott have played well in their first three games.
  • Looking at the numbers alone, a three game stretch is insufficient to give us high confidence that such success will continue in future. 
  • The Air Yards statistic is neither persistent nor predictive, and reflects the aesthetic tastes of one particular writer, rather than a desirable quarterback attribute.

Thanks to Sean J. Taylor for his methodological insight and scatterplot work. Any errors are mine alone.

@sunset_shazz is a Philadelphia Eagles fan who lives in Marin County, California. He previously wrote about Chip Kelly's Oregon bias and other topics, and contributed to the 2015 Eagles Almanac.

Tagged with Philadelphia Eagles, 2016, Carson Wentz, Dak Prescott, Air Yards, Passing Game, Quarterback, Scott Kacsmar.

October 3, 2016 by Brian Solomon.
  • October 3, 2016
  • Brian Solomon
  • Philadelphia Eagles
  • 2016
  • Carson Wentz
  • Dak Prescott
  • Air Yards
  • Passing Game
  • Quarterback
  • Scott Kacsmar
  • 2 Comments
2 Comments

Never Say Never Again

The following is a guest post by @sunset_shazz.

In the aftermath of the Global Financial Crisis, one of the key lessons learned was that you cannot afford to ignore rare events, and that you should not assume that an event that rarely occurs is the same thing as one that never transpires. One of the key errors in subprime risk modeling was the assumption that there was zero probability of home price decline. As an old colleague of mine used to say, “never is a long time”.

Which brings us to our friend David Murphy, who, a few weeks ago, with the arrogance and overconfidence of a subprime bond salesman, declared:

Are the Eagles looking to make a play up the board to draft a Quarterback of the Future?
No. Hell no. It makes no sense. Unless Howie Roseman and Pederson are the two least rational people on the planet, everything that they have done thus far this offseason tells us that there is a ZERO percent chance that they are planning to make a play for Wentz or Goff. And everything we know about Roseman tells us he is the opposite of irrational. You do not survive as long as he has without being an extremely cold, calculating, meticulous decision-maker.
So . . . no. Hell no.

Now, I agreed, ex ante, that such a scenario was unlikely. Maybe 10-15% probability by my rough guess. But only a fool or somebody with no life experience says that a future event has 0% probability. And the easiest way to test such foolishness is to ask the fool to put his money where his mouth is. If he really thinks 0% probability is a fair bet, he should jump at the chance to take money from a sucker such as myself who offers him INFINITELY more than $0 should this impossible event occur. So I did.

To his credit, he didn’t demur. Instead, he backed his tough talk with real dollars. And, of course, today, the Eagles traded a king’s ransom to move up to the 2nd pick overall. Technically the bet has not been decided; if the Eagles don’t take a QB in the 1st round, I still lose. If they do take a QB, I assume that David is a man of his word, though I ask that rather than sending me the money, he instead donate $100 directly to Connor Barwin’s Make The World Better project. He can even take the tax deduction.

Bottom line: rare events occasionally occur. Nothing has zero probability – on any given Sunday (or Wednesday!) anything can happen. And that’s why we love this game.

@sunset_shazz is a Philadelphia Eagles fan who lives in Marin County, California. He previously wrote about Chip Kelly's Oregon bias and contributed to the 2015 Eagles Almanac.

April 20, 2016 by Brian Solomon.
  • April 20, 2016
  • Brian Solomon
  • Post a comment
Comment

There Are No Shortcuts To The Super Bowl

Last March, Jeff Lurie told reporters he was was tired of waiting for the Eagles to be great. He’d seen sustained success, he’d been to a Super Bowl, and he’d watched his franchise post a solid 20-13 record (including a playoff loss) over the prior two seasons. It wasn’t enough.

“I’ve lived through a lot of division championships, a lot of playoff appearances, a lot of final four appearances, but our goal is we want to deliver a Super Bowl,” he said at the time. “And sometimes maybe I’m influenced by the notion of it’s very difficult to get from good to great, and you’ve got to take some serious looks at yourself when you want to try to make that step. It’s a gamble to go from good to great because you can go from good to mediocre with changes, but I decided it was important enough…”

On Wednesday, after firing Chip Kelly before the final game of the season, Lurie didn’t walk away from his words earlier in the year.

“I said, with Chip’s vision, it was an opportunity that he wanted to lead the way, to try to go from good to great,” he said. “In fact, I remember saying to all of you, there’s dangers in that, in terms of having two 10-6 seasons in a row, and when making significant changes, you can easily achieve mediocrity. I think it would be a shame not to try, but… that is the danger when you take a risk.”

I hope Lurie learned more than that, because his "strategy" was little more than a desperate hope. He handed over all power to Kelly, a moderately successful coach with zero experience running the intricacies of a NFL organization. 

The road to the Super Bowl is not paved with such gambles, with an outsider making a bunch of questionable bets that luckily pay off. You don’t win by cutting talent and building #culture. You don’t win with a rigid set of measurables that dictate player acquisition. You don’t win by ignoring critical positions and spending excessive guaranteed money on less important ones. You don’t win by overpaying for a subpar quarterback coming off two major knee injuries, or turning over half the roster in one offseason. That’s how you end up 7-9 in one of the worst divisions ever.

There are no shortcuts.

Remember Andy Reid’s binder? Reid came to Philadelphia with a detailed multi-year plan of how to build an organization. He arrived in 1999, overhauled the roster, brought in an impressive group of experienced coaches (including 6 eventual head coaches), drafted a quarterback in the first round, and went 5-11. In 2000 the team and young quarterback improved, overachieving to reach the playoffs. By 2001 they were one of the best teams in the conference. In 2002 and 2003 they missed the Super Bowl by inches. In 2004 they came minutes away from the trophy itself.

Lurie said he doesn’t want the middle steps, he just wants the Super Bowl, and he was willing to gamble to get there. But those middle steps are important. That’s how you build a champion—not overnight, but consistently, step by step.

The best teams in the NFL have the best talent. The best teams in the NFL have a top quarterback they drafted and groomed. The best teams in the NFL have smart, experienced coaches who adjust their schemes to the players they have. The best teams in the NFL have a front office structure that empowers multiple voices and balances scouting with analytics and financial understanding.

Going into 2016, the Eagles need to avoid the quick fix, or the allure of competing for the playoffs in year one of a new regime. That won't set the team up for long term success. (Plus, they'll likely be in the running anyway unless the putrid NFC East changes significantly in a year.)

The blueprint needs to be for a Super Bowl contender in 2018. Let's lay out what that looks like...

Front Office: Howie Roseman has a mixed reputation among fans and league sources, but he can succeed in the Joe Banner role. He has experience on the personnel side to pair with a firm grasp of the league's economics. Roseman does need to find a qualified general manager-type to run player personnel, someone less washed-up than Tom Donahoe, with more experience than Ed Marynowitz, who's not obvious idiot Ryan Grigson.

Coaching: A NFL team is a crazy thing to manage, and any head coach needs to be able to bring in the right people and command respect across the organization. He doesn't have to be a brilliant innovator on the cutting edge, but he does need to be flexible enough to adapt his schemes and techniques to get the most out of his players in each situation. The single most important skill set within that is the ability to find and develop a franchise quarterback, which is what makes a candidate like Adam Gase so attractive.

Quarterback: You cannot be a consistent Super Bowl contender until you have a quarterback. As such, you should exhaust every possible avenue to get one, especially the draft. I stand by my recipe for QB hunting laid out four years ago, on the eve of Andy Reid's firing:

Draft a quarterback early and late. Sign somebody in free agency. Trade for a promising backup. Rinse and repeat. You're never going to be able to compete for the Super Bowl until you find your one franchise guy. Might as well cycle through as many potentials as you can until you do. The financial cost of doing so is less than the opportunity cost of sitting pat with one player, [Bradford], who is statistically unlikely to ever become an elite quarterback.

In the Eagles' case, that means avoiding any multi-year guarantee to a still-unproven quantity like Sam Bradford, and perhaps letting him go entirely depending on the cost.

Roster Building: Outside of quarterback, which takes priority over everything else, the offensive line is next on the list of must-haves. Though I don't know many of the names, Jimmy Kempski's mock draft would thrill me based on the selection of two quarterbacks and three offensive linemen. Lane Johnson and Jason Kelce are the only long term building blocks you can count on there. Meanwhile, don't waste resources on the rest of the offensive skill positions, none of which will matter much until the offensive line and quarterback are fixed.

The Eagles defense needs more talent across the board, but it also likely needs a scheme that better takes advantage of the players in house. Kelly wanted a two-gapping 3-4 system, but it would be nice to see what Fletcher Cox and company could do in a one-gapping 4-3 instead.

Overall: Both the organization and its fans need patience. We were spoiled by Chip's quick turnaround, but where did that leave us? Let's plan for sustainability.

Read more: How The NFL Chewed Chip Kelly Up And Spit Him Back Out

Tagged with 2015, Philadelphia Eagles, Chip Kelly, Jeffrey Lurie, Howie Roseman, Joe Banner, Tom Donahoe, Adam Gase, Sam Bradford, Quarterback, General Manager, Head Coach, Coach Search Diary, Super Bowl, 2016, Offensive Line, Jimmy Kempski, Fletcher Cox, 3-4, 4-3.

January 4, 2016 by Brian Solomon.
  • January 4, 2016
  • Brian Solomon
  • 2015
  • Philadelphia Eagles
  • Chip Kelly
  • Jeffrey Lurie
  • Howie Roseman
  • Joe Banner
  • Tom Donahoe
  • Adam Gase
  • Sam Bradford
  • Quarterback
  • General Manager
  • Head Coach
  • Coach Search Diary
  • Super Bowl
  • 2016
  • Offensive Line
  • Jimmy Kempski
  • Fletcher Cox
  • 3-4
  • 4-3
  • 1 Comment
1 Comment

Offense Taken

The following is a guest post by @sunset_shazz.

Earlier today, DN columnist David Murphy published a contrarian piece purporting to show that the Eagles have neglected the offensive side of the ball in the draft under Chip Kelly. His lazy “analysis” consisted of counting up Eagles draft picks for the offensive and defensive units over the past 3 years. Even the dullest of readers can see the problem: this method equates the pick of Lane Johnson with that of Jordan Poyer. Or Zach Ertz and David King.

When pressed upon this obvious flaw by friend of the blog Noah Becker, Murphy accused his interlocutor of poor reading comprehension:

The Eagles spent 2 1sts, 3 2nds, 1 3rd round pick, and a 4th round pick on offensive players since 2013. https://t.co/avOT0i8dSu

— Noah Becker (@Noah_Becker) November 17, 2015

@Noah_Becker but i'm not going to annotate the piece for you. if you legitimately can't see it, then, yes, you are a poor reader.

— David Murphy (@ByDavidMurphy) November 17, 2015

Well, Mr. Murphy, we at McNabb or Kolb are both literate and numerate. One can easily assign values to the Eagles draft picks to determine the actual allocation of draft resources to each unit. The canonical draft value chart was developed by Jimmy Johnson in the early 1990s. For many years, this provided a sufficient first order approximation of relevant draft value. However, in 2012, the excellent Chase Stuart conducted an exhaustive analysis which used the approximate value provided by a player in his first five years with a team to construct a draft value curve; like all good scientists, he published his results.

Using these values, we can compute the approximate draft value allocated to each unit by the Eagles in the Chip Kelly era:

As is shown above, over the past 3 years, the Eagles picked 6 players on offense, at an average draft position of 48th overall. Although they picked 15 players on defense, these averaged at a draft position of 152nd overall. Using Chase Stuart’s draft value weights, the Eagles allocated 58% of their draft value to the offense and 42% to the defense; a balanced allocation, reflecting the front office’s desire to build a balanced team. Murphy’s claim that the offense was neglected in the draft is simply untrue (unless you believe a 1st round pick is equal to a 7th rounder).

Moreover, during our research we also discovered the earth-shattering news that the NFL has a salary cap. In 2015, the Eagles allocated $69.4 million to the offense, the highest(!) number in the league. To argue that the Eagles have neglected the offense in their allocation of resources is either lazy or disingenuous. Or both.

The Eagles’ woes are more prosaic: rather than being inattentive to the offense, the front office suffered from poor execution. Allowing the offensive line to age while failing to build adequate depth, using three high picks on one position in two years, guaranteeing money to the insipid Riley Cooper, over-allocating salary to an aging running back who has carried more than 400 times the previous season, cutting their best receiver for #footballreasons without recompense, trading a draft pick for a speculative upgrade at QB – these are all legitimate criticisms of the front office strategy. But accusing Chip Kelly of neglecting to spend resources on the offense… the evidence doesn’t support that extraordinary claim.

It’s one thing to mail in a column. It’s quite another to insult your readers’ intelligence when your obvious shortcomings are pointed out. Eagles fans and Daily News readers aren’t as dumb as some writers make us out to be. 

@sunset_shazz is a Philadelphia Eagles fan who lives in Marin County, California. He previously wrote about Chip Kelly's Oregon bias and also contributed to the 2015 Eagles Almanac.

Tagged with Philadelphia Eagles, 2015, Chip Kelly, David Murphy, Salary Cap, NFL Draft, Noah Becker.

November 17, 2015 by Brian Solomon.
  • November 17, 2015
  • Brian Solomon
  • Philadelphia Eagles
  • 2015
  • Chip Kelly
  • David Murphy
  • Salary Cap
  • NFL Draft
  • Noah Becker
  • 1 Comment
1 Comment
Newer
Older

McNabb or Kolb

The Eagles blog that outlasted two quarterbacks.

  • Blog
  • About
  • Links
  • Contact
  • Twitter→

Copyright © 2010-19 McNabb or Kolb. All Rights Reserved.