• Blog
  • About
  • Links
  • Contact
  • Twitter→

McNabb or Kolb

  • Blog
  • About
  • Links
  • Contact
  • Twitter→
WENTZ1.jpg

Time to Unleash Carson

WENTZ1.jpg

The following is a post by @sunset_shazz.

The National Football League has, over time, become a passing league. The best, most analytically sophisticated teams build around the passing game. In 2018, the final four teams in the NFC and AFC Championship games enjoyed the top 4 passing offenses, in terms of efficiency. In 2019, run-first teams are typically built by dinosaurs who can barely dress themselves.

The Philadelphia Eagles have made forward-thinking analytics a centerpiece of their strategy, and their fearless head coach is a protégé of one of the game’s great passing innovators; surely they are a pass-friendly offense?

How often do teams pass when it's up to them?

--Chiefs, Bills, Packers, Patriots all pass-heavy
--49ers and Colts very run-heavy
--To no one's surprise, Seahawks still conservative pic.twitter.com/XdnMyD00YL

— new-age analytical (@benbbaldwin) October 8, 2019

As I’ve noted before, any discussion of pass/run ratios must acknowledge the importance of game script, which is the time-weighted score differential transpiring over the course of a game. The higher a team’s game script, the greater its propensity to run in order to bleed the clock and secure the win. By the same token, a team with a negative game script is more likely to pass in order to attempt a come-from-behind victory.

Which brings us to the 2019 Philadelphia Eagles. In weeks 1-4, as we’ve been repeatedly told, this team faced a 10 point deficit in every single game. Yet, despite having fallen behind early in four of their games, the Eagles, through week 5, have been one the run-heaviest teams in the league.

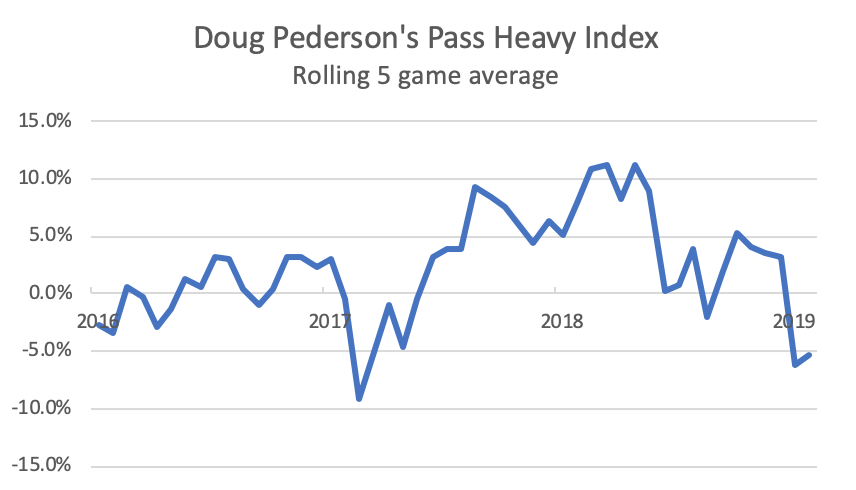
Recall the Pass Heavy Index, which computes the pass/run ratio relative to expectation given a team’s average game script:

Screen Shot 2019-10-12 at 3.06.47 PM.png

The Eagles rank 23rd in the league, passing the ball 5.5% less frequently than would be expected, given their average game script (0.5). This is their lowest rank since Doug Pederson’s first year as a head coach, with a rookie quarterback. In the last two years, the Eagles have ranked 8th and 10th in terms of situation-adjusted pass heaviness.

Screen Shot 2019-10-12 at 3.08.52 PM.png

Moreover, the first five games of 2019 have been the second most run-heavy five game stretch of Pederson’s tenure. The last time the Eagles were this run-heavy occurred during weeks 3 – 7 of the 2017 season, after Pederson endured considerable criticism from the likes of Frank and Joe from Manayunk following a week 2 loss vs Andy Reid’s Chiefs, when the Eagles passed on 75.4% of offensive plays, Pederson’s most pass-heavy game ever, given the game script (27.8% above expectation).

Screen Shot 2019-10-12 at 3.10.01 PM.png

Does the recent run-heavy approach portend a shift in tactical emphasis, or could it be merely statistical noise? The plot below shows every Eagles regular season game under Pederson’s tenure, with 2019 games in red, labeled with opponents. The regression line shows the league-wide average pass-run ratio; the degree to which a data point is above or below the line reflects the “Pass Heavy Index” for that particular game (positive or negative).

Screen Shot 2019-10-12 at 3.10.56 PM.png

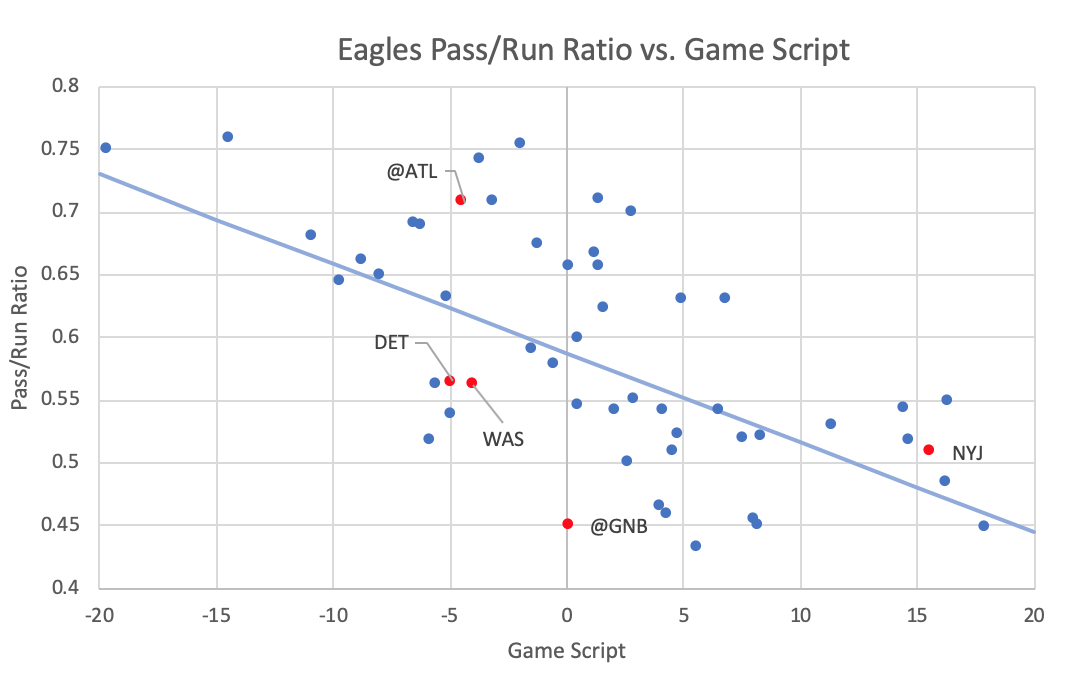
Week 2 (at ATL) and 5 (NYJ) were pass-heavy, when adjusted for game script. Week 1 (TB) and 3 (DET) were more run-heavy than is typical for a Pederson offense. A significant proportion of 2019’s run-heavy tilt is due to the sublime Green Bay game at Lambeau when Doug passed the ball 24.2% less than what would have been expected, given the game script. This game was, by far, the most run-heavy of his head coaching career. There was reasoning behind this anomaly: Mike Pettine chose to keep his defensive personnel in dime and nickel versus the Eagles two tight end sets, allowing Zach Ertz and Dallas Goedert to run block against relatively light boxes. As Jason Kelce pithily explained to Sheil Kapadia, the objective in the game was to put the defense in a bind: “Everything’s just trying to get honest numbers out of them.”

Had Pettine loaded the box with base personnel, you can be sure that the Eagles would have been pass-heavy, particularly with Goedert and Ertz on the field. Removing the unusual circumstances of the Green Bay game, the Eagles -0.5% Pass Heavy Index would rank 17th in the league. Their current league rank, in terms of pass-run ratio, is at least partly an artifact of the game-theoretical nature of Doug Pederson’s offense, which is predicated on running versus light boxes and passing versus heavy boxes.

Per the NFL ScrapR box score app created by The Athletic’s Ben Baldwin, this tactic paid huge dividends. The Eagles at Green Bay had both a higher success rate and expected points added (EPA) per play in the running game, compared with the passing game.

Against GB, he called the most run-heavy game of his career, adjusted for situation. This tactic was successful against Mike Pettine's defense, which dared the Eagles to run. Per #nflscrapr box score app by @benbbaldwin, the Eagles had higher EPA & Success Rate running the ball. pic.twitter.com/bSxRuaqHSW

— sunset shazz (@sunset_shazz) October 12, 2019

Note that a more efficient run vs. pass game is unusual. In weeks 1 through 5 of 2019, as well as during Pederson’s prior tenure, the Eagles had a higher average success rate and EPA passing the ball versus running.

I will close with a prediction: in the following weeks, Doug will unleash Carson. As defensive coordinators begin to recognize that Jordan Howard is quietly efficient running behind Jeff Stoutland’s offensive line, they will increase the number of defenders in the box.

And Pederson and Wentz will take what the defense gives them.

Tagged with 2019, Philadelphia Eagles, Doug Pederson, Carson Wentz, Passing Game, Running Game, Analytics, Sunset Shazz.

October 12, 2019 by Brian Solomon.
  • October 12, 2019
  • Brian Solomon
  • 2019
  • Philadelphia Eagles
  • Doug Pederson
  • Carson Wentz
  • Passing Game
  • Running Game
  • Analytics
  • Sunset Shazz
  • 2 Comments
2 Comments
sean mcvay.jpg

When Will NFL Coaches Stop Acting Like Sheep?

sean mcvay.jpg

The following is a post by @sunset_shazz.

We have previously discussed in these pages the principal-agent problem, and how idiot principals (aka NFL owners) are to blame for suboptimal decision-making by agents (aka GMs and coaches). In an entertaining Twitter thread, some analytics nerds were discussing the use of RPOs and the implications for run/pass decision making. A turning point in the thread:

Brian Burke believes that coaches are optimizing for success rate. They want to move the chains and string together first downs to form drives. If you get nearly 5 yards per rush on average there’s no way you’ll convince a coach to pass.

— Josh Hermsmeyer (@friscojosh) May 18, 2019

Josh is citing this piece of descriptive analysis from Brian Burke back in 2014, where Burke showed (from a positive, as opposed to normative standpoint) how coaches tend to maximize the success rate of each individual play, which doesn’t necessarily map to game-level success (“just win, baby”).

I replied with my time-worn take that this suboptimal decision-making is the fault of the principals, who have set up bad incentive structures. Sean Domnick asks an excellent question: why did the coaches choose this particular strategy? It’s not as if the owners incentives are particularly clear in favoring per-play success rate:

Yeah, right now I'm just curious about why incentives lead to success rate optimization compared to other metrics.

— Sean Domnick (@sean_domnick) May 18, 2019

The hypothesis below is drawn from social science, and is speculative.

Decision theory is a very young field. My Decision Sciences professor in the nineties came from Xerox PARC and leaned heavily on Kahneman, Slovic and Tversky. But prior to formalized decision theory, Friedrich Hayek and Edmund Burke posited mechanisms by which traditional decision-making can evolve to be “good enough” over time. Conventional wisdom improves through an iterative, blind process. In the decision space, though traditional decision-making may be suboptimal, it can still be good enough to have adaptive success. Joseph Henrich has, using modern data collection methods, formalized how norms and traditions may evolve to be broadly efficient. Bill Walsh did not have access to modern data, software or computing power. But his analysis was good enough, and was dominant enough, to change how coaches stretch the field and emphasize short passes.

Yes, per-play success rate is suboptimal. But it is an evolutionarily stable strategy in that it is dominant, provided that nobody has implemented a better strategy. Moreover, to the extent that norm violators are punished (cf. Henrich) herding behavior is a rational response to the threat of being fired. Thus, a “good enough” strategy such as per-play-success-rate maximization will perpetuate because everybody is doing it.

1)     Maximizing success rate, though suboptimal for maximizing wins, has the advantage of being an easy, tractable heuristic that dominates over other, worse, decision rules.

2)     Over time, principals and agents will coalesce around this (arbitrary, though minimally successful) decision rule, which becomes self-perpetuating.

Is this equilibrium stable? It is until it isn’t. Just as Roger Bannister showed the world what is possible, it takes only one coach to show that sound evidence-based decision-making will dominate the conventional wisdom. We are at a moment in time when internet nerds are mining data to show the traditionalists there is a better way. My tentative prediction is that NFL coaching heuristics will change for the better, just as they have in the NBA and MLB.

Tagged with Sunset Shazz, 2019, NFL, Coaching, Ownership, Brian Burke, Play Calling.

May 18, 2019 by Brian Solomon.
  • May 18, 2019
  • Brian Solomon
  • Sunset Shazz
  • 2019
  • NFL
  • Coaching
  • Ownership
  • Brian Burke
  • Play Calling
  • Post a comment
Comment
jerry-jones-cowboys.jpg

Why Is NFL Decision-Making So Bad?

jerry-jones-cowboys.jpg

The following is a guest post by @sunset_shazz.

Now is the winter of our NFL offseason, during which we contemplate Nick Foles’ trade value, as well as Joe Flacco’s. On twitter, @agoldman79 makes a key observation:

This assumes rational actors. When trades like the Amari Cooper trade happen, it disproves that.

— Adam (@agoldman79) February 9, 2019

To paraphrase Larry Summers: There are bad GMs. Look around. Our friend Brent at Eagles Rewind wrote about #BadGMTheory way back in 2013, and the evidence continues to accumulate. The 32 NFL teams, as a whole, seem to make decisions which are suboptimal. For example, Bucs GM Jason Licht, who is 27-53 (0.338), famously traded up to draft a kicker in the 2nd round, yet still enjoys a W-2 income. Giants GM Dave Gettleman ignored the data, mocked the nerds at their keyboards, and drafted a running back with the 2nd overall pick. Though an excellent player, the offensive rookie of the year has not proven to be worth either the high pick or the highest guaranteed salary for a running back in the NFL. Other GMs are adept at public relations while remaining cartoonishly inept at actual decision-making. Sam Bradford’s candidacy as a First Ballot Hall Of Fame Negotiator rests entirely on the exploitation of incompetent counterparties. I have found, previously, evidence that NFL GMs inefficiently prefer white candidates, to the detriment of playoff berths, when hiring coaches. All these decisions are examples of terrible ex ante process, regardless of ex post outcome.

Why is NFL decision-making so bad?

In an intensely competitive, testosterone-and-bravado-fueled meritocracy, why is NFL organizational stupidity so pervasive, persistent and pronounced?

I am always suspicious of monocausal reasoning, and my guess is that the answer is likely multivariate: NFL culture is dominated by “football guys” who are resistant to change, there is an old boy network that inhibits ideas from other domains from propagating, and of course there are idiots.

Ultimately, the crux of the principal-agent problem lies with the principals, rather than the agents. NFL owners are bad at setting the incentives for their employees. Dirk Koetter (as a coach, not a GM) admitted on the record that he made decisions in order to keep his job, even when he knew it would lose more games in the long run. But this answer merely begs the question.

Why are NFL owners so bad?

A key theoretical underpinning of the Efficient Market Hypothesis (EMH) is that “noise traders” (idiots) will have less influence over time than their more successful counterparties. Market forces impose a Hobbesian, Darwinian discipline, through losses (rather than profits): those that are unfit perish.

For NFL teams, relative profits (there are never losses) are not determined by a market. Each team shares a common pool of more than $8 billion in league-wide revenue which is derived from gate sales, merchandising, broadcast rights, etc. The NFL is a Marxian socialist’s paradise. You can be an incompetent charlatan who has committed fraud and racketeering and your NFL team will still make money because (a) the team has a franchise which effectively secures monopoly rents and (b) revenue sharing by the NFL creates the most generous social safety net the world has ever seen.

Simply put: the NFL lacks a mechanism for creative destruction.

Very few other domains of American life enjoy such coddled insulation from market forces. A hedge fund that defaults on a trade typically blows up. A dishwasher, housekeeper or middle class entrepreneur who behaves as incompetently as the Browns would face inevitable penury. Only Jed York is afforded the latitude to be as incompetent as Jed York.

The NFL’s socialist utopia is sanctioned by a Federally-mandated antitrust exemption. Never mind Alexandria Ocasio-Cortez – the most fervent big-government socialists in America are represented at 345 Park Ave. As a consequence, the relative absence of market discipline allows them to make decisions with the acuity of Soviet central planners. Incompetents of the world, unite!

Tagged with NFL, Offseason, General Manager, NFL Draft, Ownership, Sunset Shazz, Guest Post.

February 18, 2019 by Brian Solomon.
  • February 18, 2019
  • Brian Solomon
  • NFL
  • Offseason
  • General Manager
  • NFL Draft
  • Ownership
  • Sunset Shazz
  • Guest Post
  • Post a comment
Comment
B80E8860.jpg

On Dallas Goedert And The Eagles' Two-Tight End Dominance

B80E8860.jpg

Are you curious why the Eagles drafted a second tight end, Dallas Goedert, when they already have Pro Bowler and Super Bowl-winner Zach Ertz on the roster? Look no further than The Athletic, where I penned an article recently that examined the Eagles' use of multiple tight end sets last year. The numbers surprised me, especially what emerged about the Eagles in the red zone, in the playoffs, and specifically the effectiveness of Ertz and Trey Burton in the same formation. Make sure to subscribe to The Athletic Philly (hat tip to the inimitable Sheil Kapadia for asking me to contribute) and check it out:

‘Big bodies on smaller bodies’: Why the Eagles doubled down on the two-tight end offense

Tagged with 2017, 2018, Tight End, Zach Ertz, Dallas Goedert, Sheil Kapadia, The Athletic, Brent Celek, Trey Burton, Doug Pederson, NFL Draft.

May 18, 2018 by Brian Solomon.
  • May 18, 2018
  • Brian Solomon
  • 2017
  • 2018
  • Tight End
  • Zach Ertz
  • Dallas Goedert
  • Sheil Kapadia
  • The Athletic
  • Brent Celek
  • Trey Burton
  • Doug Pederson
  • NFL Draft
  • Post a comment
Comment
gettleman.gif

Dave Gettleman Vs. The Nerds

gettleman.gif

The following is a guest post by @sunset_shazz.

New York Giants General Manager Dave Gettleman is a true football man (#TrueFootballMan). He has no time for nerds who sit behind their keyboards. Though some may be concerned about drafting a running back second overall, he is not. From his recent presser after picking Saquon Barkley:

I think a lot of that’s nonsense. I think it’s someone who had this idea and got into the analytics of it and did all these running backs and went through their – whatever. Hey, Jonathan Stewart is in his 10th year and he’s hardly lost anything.

Gettleman appears to believe that the case against using a top 10 pick on a running back rests on perceived longevity. He is misapprehended.

Ben Baldwin, an economist (and Seahawks fan) who makes his living sitting behind his keyboard, summarized the case against using a premium pick on a running back in an excellent post at Field Gulls – do read the whole thing. I’m going to expand on two subsets of his argument: that rookie first round running back contracts are bad values, and bad risks.

The objective of the first round of the NFL draft is to sign an above-average player at a below-average contract for 4 years, with an embedded team option in year 5. Article 7 of the 2011 Collective Bargaining Agreement specifies a rookie wage scale that varies based on the draft pick used to select the player. Importantly, after the 2011 CBA was implemented, the player’s position doesn’t matter: a player picked 2nd overall is paid the same money over 4 years, whether he is a quarterback, running back or long-snapper. Moreover, the market has reached an equilibrium where first round contracts are fully guaranteed. A quick survey of contracts at overthecap.com shows that position value for post-rookie contracts varies significantly in today’s NFL. As a result, the “rookie contract discount” varies dramatically by position. For example, a QB drafted with the 2nd overall pick in 2018 would be the 25th highest paid QB in the league (by average annual compensation) and would have the 15th highest guaranteed money. An RB selected 2nd overall would immediately become the 4th highest paid player at his position, with the highest guaranteed money – all before taking a single professional snap.

Graph 1.png

The chart above shows selected positions, with their leaguewide positional salary rank plotted against overall draft number (all data courtesy overthecap.com). Running back is the clear outlier – a top 10 pick is automatically among the highest paid RBs in the league.

Here is the same plot for guaranteed money (the rookie contract is compared to the veterans’ amount guaranteed on their current contracts):

Though the 2011 CBA’s wage scale typically serves as a price ceiling for rookies, with running backs drafted in the first round, it serves as a de facto price floor. In terms of guaranteed money, the three highest RB contracts in the league are Barkley (2018, drafted 2nd overall), Leonard Fournette (2017, 4th) and Ezekiel Elliott (2016, 4th). Here are the top 10 picks in this year’s draft, with their annual compensation and total guarantee compared to their league peers by position group (players in top 10 highlighted in red):

Table 1.png

The New York Giants have thus expended the #2 draft pick (a considerable use of capital) for the privilege of paying Barkley the #4 annual salary and #1 guarantee at his position. They are paying (through the nose) not just once, but twice!

But perhaps Gettleman is merely acting upon justified conviction. If Barkley is a generational player, surely he’s worth it?

As Ben Baldwin notes in his piece, 1st round running backs have a high bust rate relative to other positions. Data scientist Dr. Sean J. Taylor sent me the following plot, exploring this idea further:

Graph 3.png

This plot evaluates the set of running backs drafted (or undrafted) between 2009 and 2014. The x-axis represents draft position. The y-axis is the player’s Wins Above Replacement (nflWAR) over the ensuing 4 years. NflWAR is a statistic developed by Yurko, Ventura and Horowitz of Carnegie Mellon University which uses multinomial logistic regression to isolate the contribution of individual players to NFL wins. NflWAR represents a novel effort to advance beyond Approximate Value (AV), and deserves wider recognition.

I draw 3 conclusions from the scatterplot above:

1.     Taking a running back early is risky (bottom left quadrant);

2.     It is possible to find success at running back in later rounds;

3.     Running backs don’t really matter very much (note the Y-axis scale – over 4 years, you get at best 1.5 extra wins from a running back, and typically 0.25 extra win; quarterbacks are approximately 4x more important).

The risk of a bust is even more acute with highly drafted running backs, because the financial commitment to the player is so much higher, relative to other players at the same position. A bust at QB taken at 2nd overall saddles you with the salary of a bottom quartile starter. A bust at RB at the same pick saddles you with a top 4 salary.

But there is no good alternative to taking such a risk, right? Don’t you need to take risks at RB in order to win championships? Ezekiel Elliott, Leonard Fournette and Todd Gurley (taken 4th, 7th and 10th overall, respectively) are commonly cited as evidence of risks that have paid off.

One recurrent theme here at MoK is the application of insights from behavioral science to football. Our past posts have relied heavily on the work of Gary Becker, Daniel Kahneman & Amos Tversky, William F. Sharpe, Kahneman and Tversky again and Joseph Henrich. Today’s post is dedicated to 1990 Nobel Laureate Harry Markowitz who demonstrated that a portfolio of individually risky assets can collectively carry less risk than any of its underlying constituents, even when adjusted for its prospective return.

The above chart shows the three commonly cited high pick successes, and the RB-by-committee groups of the two Super Bowl teams. The “Draft Capital” column dispenses with the archaic Jimmy Johnson scale, instead using Dr. Michael Lopez’s blended draft curve which improves on prior efforts by not only paying attention to expected/modal outcomes, but also giving weight to the probability of drafting a superstar (i.e. the right tail of the distribution). PHI and NE expended between 1/4 and 1/7 the draft resources for their running backs as JAX, DAL and LAR. Though PHI and NE paid relatively high 2017 cap numbers, they locked up minimal resources over the long term (i.e. they could cut bait in 2018). The “gty” column shows guarantees over the entire contracts of those players (Sproles’ and Blount’s initial guarantees for PHI, Gillislee’s, Burkhead’s and White’s for NE).

The advantage of the portfolio approach is: you can be wrong, and still have success. Donnel Pumphrey is not good at football and Darren Sproles was lost for the season. Gillislee, Burkhead and White did not cover themselves in glory in 2017. The portfolio approach diversifies you against injury, suspension or disappointing play. Yet, each portfolio achieved similar yards/attempt and total yards as the 3 high draft picks, for less overall guarantee / draft capital. As a team, NE and PHI ranked 1st and 8th in offensive DVOA, respectively (the Eagles won the Super Bowl). Also, note that NE’s total 2017 expenditure, while high, was less than Le’Veon Bell’s cap number. JAX additionally paid $6MM in 2017 for Chris Ivory, who offered minimal return for this expenditure. As Harry Markowitz showed, the portfolio approach offers something vanishingly rare in economics: a free lunch. A properly constructed portfolio lowers risk, without sacrificing expected return. (Though running backs are risky, they are independently risky. Idiosyncratic risk is diversifiable.)

In summary, Dave Gettleman in his press conference constructed a straw man. The case for positional value does not rest on running back longevity. Instead the TL;DR argument is as follows:

  • Using a high draft pick on a running back is a bad bet. At best, you expend draft capital in order to pay a guaranteed contract at a market equivalent price for a good player. At worst, you overpay twice: in draft capital and guaranteed salary for a bad player.
  • Drafting a running back is risky.
  • By assembling a portfolio of RBs, one can achieve similar performance to drafting a star, while diversifying risk, and saving draft / guarantee capital to deploy elsewhere.
  • Your mother was right about eggs and baskets.

The above argument relies upon the prior work of a number of individuals who sit behind keyboards, all of whom have advanced degrees in a quantitative field such as economics, and none of whom have played a snap of professional football. Gettleman, a #TrueFootballMan, will confidently dismiss this argument, regardless of its merit, due to its provenance. Eagles fans should pray he never gets fired, and lives forever.

Tagged with 2018, NFL Draft, Running Back, Dave Gettleman, New York Giants, Statistics, First Round, Quarterback, Salary Cap.

May 3, 2018 by Brian Solomon.
  • May 3, 2018
  • Brian Solomon
  • 2018
  • NFL Draft
  • Running Back
  • Dave Gettleman
  • New York Giants
  • Statistics
  • First Round
  • Quarterback
  • Salary Cap
  • Post a comment
Comment
nick-foles-takes.jpg

Nick Foles Is The Playoff GOAT

nick-foles-takes.jpg

The following is a guest post by @sunset_shazz.

Nick Foles is a high-variance quarterback. His performance ricochets from abysmal to sublime with such frequency that he made me re-adjust my chart axis, twice. And yet: including the 2013 loss to the Saints (in which he engineered a comeback from a 13-point deficit and left the field with the lead) his postseason play has been consistently excellent. There have been 93 quarterbacks since the 1970 merger who have played at least 4 playoff games. Of these, Foles ranks 1st in completion percentage and 2nd in Adjusted Net Yards / Attempt (ANY/A).

Screen Shot 2018-02-12 at 11.50.18 PM.png

Obviously, this is not statistically dispositive. Nothing about playoff analysis is. Mark Messier and Reggie Jackson’s playoff performances comprised a mere fraction of their total careers, yet their knack for elevating their game on the biggest stage is what made them memorable. One way to think about the playoffs: there is a tide in the affairs of men, which, taken at the flood, leads on to fortune. As I will show, Foles has taken the tide at the flood in historic fashion.

Note, from the chart above, that the fewer games played, the greater variance in ANY/A between individual players. But what about each player’s game-by-game variance? I measured the standard deviation of each player’s game ANY/A, and scaled this by his mean ANY/A, thus constructing a coefficient of variation.

Screen Shot 2018-02-12 at 11.50.57 PM.png

Of all 93 QBs in the sample, Foles has been the 4th most consistent (i.e. has the 4th lowest variation). Moreover, he has the lowest variation of the 16 QBs who have only played 4 games.

Perhaps Foles has benefitted from playing in a QB-friendly era? I compared each QB’s game ANY/A to the league average for the year in which that game was played. One can then plot mean Relative ANY/A against the coefficient of variation:

Screen Shot 2018-02-12 at 11.52.21 PM.png

Foles has the 5th highest Relative ANY/A in addition to having the 4th lowest variation. One way to think about the above graph is to imagine an “efficient frontier” on the upper left quadrant. When considering similar efficient frontiers in the context of financial economics, Nobel Laureate William F. Sharpe constructed a “Sharpe ratio” which compares a fund manager’s relative return (e.g. versus an index) to the standard deviation of the fund’s return.

I similarly devised a playoff QB Sharpe Ratio, which is each QB’s mean Relative ANY/A divided by the standard deviation of his game ANY/A. Think of it as one number which captures both efficiency and consistency of play. The following table shows the top 10 playoff QB Sharpe Ratios since the merger:

Screen Shot 2018-02-12 at 11.52.51 PM.png

All 10 of these quarterbacks played in a Super Bowl, and all but two of them were champions. Only Bengals starter Ken Anderson and Bills backup Frank Reich did not win the season’s final game. (Reich, of course, will receive a ring as Offensive Coordinator of the 2017 Super Bowl champions.)

By this metric, Foles will have to settle for second place out of 93 playoff QBs. The Raiders’ Ken Stabler, who played in 13 playoff games between the 1971 and 1979 seasons, passed for 3.08 ANY/A above average (3rd) and had the 8th lowest coefficient of variation in the sample. Combining efficiency and consistency, he is the greatest playoff quarterback of all time. Here are the rankings of some other notable QBs, and Eli Manning:

Screen Shot 2018-02-12 at 11.53.23 PM.png

Obviously, I’m not suggesting Foles is better than any of those quarterbacks (except Eli; he’s indisputably better than Eli, it’s not even close). However, in the inherently limited sample that consists of the playoffs, Foles has performed at a historically great level, in terms of both efficiency and consistency. Also, he can catch.

Tagged with Super Bowl, Nick Foles, 2017, 2018, Playoffs, Quarterback, Statistics.

February 13, 2018 by Brian Solomon.
  • February 13, 2018
  • Brian Solomon
  • Super Bowl
  • Nick Foles
  • 2017
  • 2018
  • Playoffs
  • Quarterback
  • Statistics
  • Post a comment
Comment
usatsi_9540580.jpg

Clearing Up The Coaching Confusion

usatsi_9540580.jpg

The following is a guest post by @sunset_shazz.

Should the Carolina Panthers have fired Head Coach Ron Rivera or traded QB Cam Newton the day after they lost the Super Bowl? Scott Kacsmar at FiveThirtyEight argues they should have done either or both. Do read the whole piece; the argument is presented as follows:

  • In NFL history, only 4 coaches have won their first Super Bowls after 5 seasons on the job with the same team;
  • No team has ever started the same quarterback under the same head coach for more than 5 years and seen that duo win its first championship.

Having examined the history of prior first time Super Bowl winners, FiveThirtyEight infers that these characteristics are conducive to winning championships. The study’s conclusion: “If championship success doesn’t come within five years, things tend to get stale, and someone eventually has to move on from their position of power.”

Can you spot the flaw in this reasoning?

How about if I used the same exact logic, using a more emotionally salient characteristic:

  • In NFL history, only 4 minority head coaches have won Super Bowls. Therefore you shouldn’t hire minority head coaches. [1]

Does that framing device make the flaw in reasoning clearer?

FiveThirtyEight’s study suffers from the confusion of the inverse, a statistical fallacy that undergraduates are commonly taught to avoid. One of the best recent treatments of this problem was a brilliant piece by Katherine Hobson on the lab-testing startup Theranos  (also, funnily enough, at FiveThirtyEight). Chapter 8 of Nate Silver’s excellent The Signal and the Noise provides a lucid discussion on this topic, in the context of Bayes’s theorem.

Here is the issue: the fraction of Super Bowl winners that possess a certain characteristic, by itself, tells you nothing about the probability that those who possess that characteristic will win a Super Bowl. A better way to estimate the latter would be to go back and examine the historical success rate of coaches who possess the characteristic you’d like to study.

I compiled every season coached since the 1970 merger, then excluded the seasons after a coach has won his first Super Bowl.  Coaches who were tenured 5 years or fewer with their teams won 24 first Super Bowls in 1009 opportunities, for a success rate of 2.38%. Coaches tenured 6 or more years won 4 first Super Bowls in 176 opportunities, a 2.27% success rate. Using a technique previously used in the Duck Bias study, I applied the cumulative distribution function of the binomial distribution to test whether the success rates were different, to a statistically significant degree. The P value of 0.592 indicates no statistically significant difference.[2]

However, Super Bowl success is a noisy, sparse data set, due to the very small sample size. An alternative measure of coaching success which enjoys the advantage of more data is the frequency with which a coach makes the playoffs. I compiled the playoff rate for every coach in the dataset, and compared this with the base rate of success for that year.[3] The data shows that coaches with longer tenure are actually ­­more likely (47.7%) to make the playoffs than shorter tenured coaches (31.1%) and the base rate (38.0%); both of these differences are statistically significant.

Obviously, this data doesn’t tell you anything about causation. There is likely a survivorship bias / selection effect: those coaches who are kept by their team after 5 years without a championship are likely of higher quality than average, which is probably why their subsequent success rate is higher.

Screen Shot 2018-01-11 at 11.11.37 AM.png

For Coach-QB pairings, 28 Super Bowls were won in 1137 opportunities for the short tenured pairs, a 2.46% success rate. There were only 48 seasons where a Coach-QB pairing lasted more than 5 years without having won a Super Bowl. The zero success rate is, statistically speaking, the effect of randomness, rather than a measured effect. In terms of playoff success rate, once again the longer tenured coaches had a higher success rate, though this effect was not found to be statistically significant.

Screen Shot 2018-01-11 at 11.13.03 AM.png

The data is pretty clear: you shouldn’t fire your coach, or your QB, just because he has not won a Super Bowl after an arbitrary number of years. The only reason short tenured coaches seem to have been historically more successful is they vastly outnumber the long tenured ones. FiveThirtyEight’s model was fooled by the fallacy of the inverse.

But given that we’re in the midst of a coaching carousel accompanied by a Rooney Rule kerfuffle: what about the reductio ad absurdum argument I cheekily proffered above? What does the data say about minority head coaches?

I used Wikipedia’s Rooney Rule page to code every minority head coach in the dataset, presented below. This data comprises every coaching season between 1970 and 2016, including all seasons for coaches who won multiple Super Bowls.

Screen Shot 2018-01-11 at 11.14.05 AM.png

Minority coaches won Super Bowls in 3.31% of their opportunities, which is statistically indistinguishable from the base rate of success of 3.22% (note that minorities have disproportionately coached in more recent years, after the league has expanded, which lowers the base rate of championship success). Interestingly, minority coaches made the playoffs 58 times in 121 opportunities (47.9%) which is 11.6 more times than one would expect given the base rate, a difference that is statistically significant (p=0.02). This is a noteworthy result: historically, the presence of a minority head coach is associated with a 25% greater rate of making the playoffs.

Again, one shouldn’t make causal inference claims from historic data. I’m not arguing that minorities are inherently better coaches. In this situation, there is no survivorship bias. Might there be a selection effect? The late Nobel Laureate Gary Becker argued in 1957 that employment discrimination (racial or otherwise) is inefficient. Not only does the victim of discrimination bear a cost, but so does the discriminating employer (through lower productivity per unit labor cost). Axiomatically, to the extent that some employers exhibit an unfounded bias, an employer who doesn’t discriminate can capture a portion (but not all) of the foregone surplus. Moreover, selecting from a pool of employee candidates who are the victims of racial discrimination will yield supernormal productivity. Becker’s theory of discrimination is one plausible explanation for the effect shown by the data.

What does this mean for NFL teams today? The data is unequivocal that Ron Rivera shouldn’t be fired solely because he hasn’t yet won a Super Bowl. The data also shows that Al Davis, who got many things wrong, got a few things very right. An NFL team should examine the pool of minority head coach candidates very carefully, and should strongly consider hiring from this pool.

Not merely because it’s the right thing to do, but because the data suggests it helps you Just Win, Baby.

[1] To be clear, this is not argued by FiveThirtyEight. I employed this reductio ad absurdum to permit the reader to more easily intuit the confusion of the inverse.

[2] The P-value is the probability that, conditional on the null hypothesis being correct (i.e. no effect), one would observe the data in question by chance. Though subject to recent debate, the conventional standard for social science is to reject P-values greater than 0.05.

[3] The base rate of success is # of playoff teams / # of total teams in the league, both of which have changed over time. I accounted for the league’s expansion of teams in 1976, 1995, 1999 and 2002, as well as the evolution of the playoff format from 8 to 12 teams in 1978 and 1990, and the 16 team playoff that occurred during the strike-shortened 1982 season.

Tagged with 2018, Scott Kacsmar, FiveThirtyEight, Coaching, Super Bowl, Statistics.

January 11, 2018 by Brian Solomon.
  • January 11, 2018
  • Brian Solomon
  • 2018
  • Scott Kacsmar
  • FiveThirtyEight
  • Coaching
  • Super Bowl
  • Statistics
  • Post a comment
Comment
sashi-brown-a41a45d32683cf06.jpg

Numbers Are No Substitute For Trust

sashi-brown-a41a45d32683cf06.jpg

The following is a guest post by @sunset_shazz.

The news of Cleveland head of personnel Sashi Brown’s dismissal was met with uncharacteristic emotion by the customarily sober Aaron Schatz. Evidently, some quarters of the analytics community regard Brown, his colleague Paul DePodesta and the rest of the Browns front office team as one of their own. Brown’s strategy consisted of trading high draft picks for more (albeit lower ranked) picks. The opportunity cost of this strategy was to pass on both Deshaun Watson and Carson Wentz.

Talent evaluation is hard. You will be wrong more often than you will be right. I won’t fault Brown for misevaluating quarterbacks, just as I don’t fault 32 teams for repeatedly passing on Tom Brady (even the Patriots passed six times before using their 7th highest pick on him). There is data that suggests the market for talent evaluation is efficient and that no team has a sustainable edge.

But it doesn’t follow that just because you aren’t able to out-evaluate your peers, you should always trade down. Higher draft picks have higher success rates. The idea that lower picks might be undervalued dates from a classic 2005 paper by Cade Massey and newly-minted Nobel Laureate Richard Thaler. Massey-Thaler observed that NFL teams were overvaluing high picks relative to “the surplus value of drafted players, that is the value they provide to the teams less the compensation they are paid.” (Emphasis in the original.)

Two things have changed since 2005. First, the 2011 Collective Bargaining Agreement repriced the rookie wage scale, increasing the “surplus value” of higher picks relative to lower picks. [1] Secondly, the market learned and absorbed the Massey-Thaler result. We know from other domains that market inefficiencies almost always disappear as soon as they are found. Sashi Brown’s claim that talent markets are efficient – yet the market for picks is systematically inefficient – is an extraordinary claim, which demands extraordinary evidence. More likely, the market has moved from partial to general equilibrium. Football has no farm system; the strategy of hoarding picks is constrained by the 63-man roster and practice squad. Successful teams with quietly robust analytics departments (e.g. the Eagles and Patriots) trade both up and down, depending on the situation; constrained optimization is complicated. Moreover, as Brian argued in 2011, in order to fill the most critical position on an NFL team, the data shows you need to pick early.

But the real reason that Jimmy Haslam absolutely had to fire Sashi Brown is simple: his staff failed to execute a trade which was negotiated in good faith. Whether it exists under a buttonwood tree in lower Manhattan or in a coffee house in eighteenth century London, all markets are governed by rules, traditions and norms. As an example, the market for trading picks, which often occurs while teams are on the draft clock, is governed by trust and verbal agreements (not legal documents).

As Joseph Henrich notes in his brilliant anthropological survey The Secret of Our Success, pro-social norms are enforced in small communities through punishment, such as ostracism. In any community of traders, walking away from a duly negotiated agreement is a flagrant violation, a taboo. I will never forget how at the beginning of my career the head of our firm reacted to a similar situation: “We will never do business with those scumbags again, and we will make sure everybody knows how they have behaved.”

Punishing norm violators is not irrational. A trust-based community of traders is a fragile equilibrium. Erosion of trust can cause permanent, deadweight losses; thus pro-social norm enforcement evolves over time, and is Pareto efficient.

If Haslam had not fired Brown, some or all of the other 31 teams would have punished the norm violator by refusing to trade with Cleveland. This is both individually rational (trading with a deadbeat counterparty is risky) and collectively rational (pro-social norms promote gains from trade). Brown’s reputation as a counterparty was permanently impaired, thus compromising his ability to discharge his duties, and leaving Haslam with no choice but to clean house.

[1] Brian Burke found continued persistence of a second day surplus value anomaly, though it’s still early in terms of data, and as he notes, the replication model is sensitive to key methodological assumptions. His results cover the player market, but not the draft pick market.

Tagged with Cleveland Browns, Brian Burke, NFL Draft, Trade, Sashi Brown, Aaron Schatz.

December 8, 2017 by Brian Solomon.
  • December 8, 2017
  • Brian Solomon
  • Cleveland Browns
  • Brian Burke
  • NFL Draft
  • Trade
  • Sashi Brown
  • Aaron Schatz
  • 1 Comment
1 Comment
Older

McNabb or Kolb

The Eagles blog that outlasted two quarterbacks.

  • Blog
  • About
  • Links
  • Contact
  • Twitter→

Copyright © 2010-19 McNabb or Kolb. All Rights Reserved.