So a couple weeks back I took a look at some of Football Outsiders’ stats on Donovan McNabb to gauge how good he actually is and how good he might be over the next couple years. Go check out that post if you haven’t already, but in this part I’m going to dive into some other stats to see if they match up to the same picure the DVOA ranks gave us.
I gathered new information from the awesome site Advanced NFL Stats. The author over there, Brian Burke, puts some great stats up on all sorts of statistical parts of the NFL. But he just launched a section that breaks down stats by postions. It’s fabulous stuff. And while the individual player pages aren’t live yet, you can manipulate your url to get to them pretty easily. Check out McNabb here. Westbrook here. DeSean here. Etc.
As I talked about last time, it’s difficult to compare stats across multiple years, because the overall game changes so much. For example with McNabb, his 2009 stats look great compared to his past performance, until you realize many quarterbacks did a lot better last year. To get a true sense of McNabb’s “value” you have to look at how he ranked against the other quarterbacks in each stat. Thus, each stat below is shown based on how McNabb stacked up, not the exact number he got. (Random caveat: all of the Advanced Football Stats include playoff numbers.)
Alright, let’s dive in. The first stat is Win Probability Added (WPA), which “measures each play in terms of how much it increased or decreased a team’s chances of winning the game.” You can get the statistical breakdown of what that means at the link, but Burke also describes how we can utilize it:
WPA is what I call a narrative stat. Its purpose is not to be predictive of future play or to measure the true ability of a player or team. It simply measures the impact of each play toward winning and losing… And although we still can’t separate an individual player’s performance from that of his teammates’, we add up the total WPA for plays in which individual players took part. This can help us see who really made the difference when it matters most. It can help tell us who is, or at least appears to be, “clutch.” It can also help inform us who really deserves the player of the week award, the selection to the Pro Bowl, or even induction into the Hall of Fame.
McNabb has been involved in so many plays with the Eagles that looking at his WPA probably says as much about the offense and other factors as anything else. But it’s still a useful place to start. Where does McNabb rank year over year:
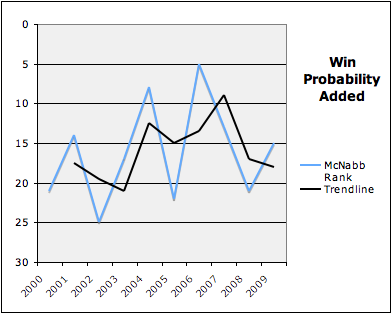
The numbers are incredibly volatile, but the list of top quarterbacks who lead in the category last year looks pretty accurate — so we know it’s worth a look. Not sure if the trendline there is helpful, but I left it on. McNabb has had three relatively middling years according to WPA, after posting two top 10 seasons over a three year span from 2004-2006. Clearly not elite anymore.
Let’s look at some more stats. Success Rate is:
the percent of plays in which the player participated that result in an increase in net expected point advantage. SR measures consistency as opposed to the total magnitude of each play’s outcome.
Ah consistency, McNabb’s bugaboo. Let’s see what it says.
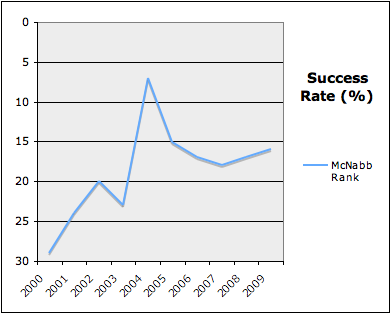
Well that pretty much jives with our expectations, doesn’t it? Only one year (2004) of above average success rate. Everything else since then is mediocre at best. Last year McNabb posted a 47.7% success rate, which basically tied him with the dynamic duo of David Garrard and Kyle Orton. For comparison’s sake, Peyton Manning had 56.6%. Clearly McNabb is not the most accurate or consistent quarterback. Part of that may be on Andy Reid’s offense as well. Would it change under a new quarterback? Tough to tell, but this clearly isn’t (and has never been) a great indicator for Donovan.
Moving on to Adjusted Yards per Attempt, calculated as (PassYds - SkYds - 45*Ints)/(PassAtt + Sks). It’s supposed to be a more accurate indicator than simple YPA.
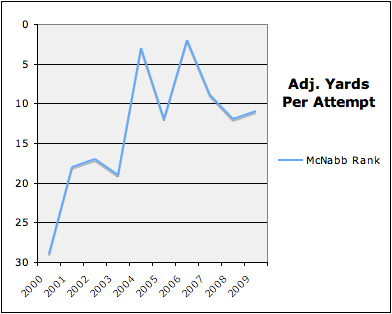
AYPA is a little more kind to McNabb than the other two stats, placing him at about the top ten mark over the last three years. Certainly that’s a solid, if unspectacular, rank. However, we still see the general trend upwards and then a more recent decline/plateau.
So what to do with all of these numbers? We’ve got our traditional stats, our Football Outsiders, our Advanced NFL Stats. Where’s the middle ground? What’s the takeaway?
I think this might be the point:
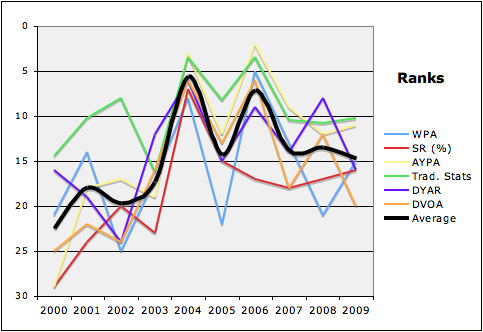
I combined all McNabb’s ranks from this time, plus all those from last time, into one handy graph and worked out the average line. I think looking at all of these at once is helpful. Some ideas:
Are any one of these stats “more reliable” than another? Doubt it. But we can see which ones rank McNabb higher and which grade him out lower than average. Derek’s traditional stats, for example, are consistently higher than the other statistics. That goes against the whole “Is McNabb Under-Appreciated?” meme and at least poses the question, “Is McNabb slightly over-estimated?” based on regular numbers. Those stats still follow the same basic trend as everything else though.
2005 was just an off, bad year. The Eagles were in the smack middle of McNabb’s prime and TO and injuries and everything had to ruin it. Should have been a top 5 season for Donovan. Still makes me mad.
The various numbers bunch up much more during McNabb’s most successful seasons. That could be due to a couple different factors. It may be that a good offensive year means many of these stats will show high performance, whereas a mediocre offensive year finds some things that are working and some that are not. Or it could be that as you put up a middle-of-the-bell-curve season it’s easier to slip around a few slots in the QB rankings than it is when you put up spectacular numbers.
Regardless, the average line there makes a pretty good case, by factoring out as much individual statistical bias as possible, that McNabb has been barely more than average over the last few years. Yes, the numbers are all tied to other factors, like wide receiver performance and offensive line play and coaching decisions and defensive variance. But those things have all (except for coaching) changed drastically over the last three years while McNabb’s play stayed fairly constant.
If you believe this analysis, it’s tough to say McNabb is really worth keeping around over Kevin Kolb, at least for much longer. An “average” quarterback just isn’t worth that much — especially if he’s older. His play, and trade value, is only likely to decline from here. We could expect (although not guarantee) at least similar performance from Kolb in a cheaper, younger version with more upside.
Thoughts, ideas, suggestions?