Despite disappointing results in the last two games, the Eagles are a good football team. Going into this week, they were first in the NFL in point differential and second in DVOA. Now, they remain third-best in the former and should stay near the top in the latter.
Two losses, by a combined score of eight points, do not end the season. But they do show us what kind of team the Eagles are: one that can't afford to make mistakes if they want to compete for the division title.
The truth is that the Eagles don't have many difference-making players. Fletcher Cox and (old but still great) Jason Peters, perhaps. After those two, who can the team count on to consistently win individual match-ups? Carson Wentz has flashes of brilliance. Third down back extraordinaire Darren Sproles is the only explosive play maker on offense.
This roster isn't built to exploit mismatches in talent. It's built on competence. On defense, guys like Brandon Graham, Jordan Hicks, and Malcolm Jenkins form the core, but none of them are keeping offensive coordinators up at night trying to scheme around them. They are good because they do the right thing (most of the time). They won't get you killed and they can succeed within the scheme. Ditto on offense: Jordan Matthews and Zach Ertz are solid starters in the NFL as long as you're not counting on them to be the number one option.
The early season win streak was built on competence in all phases. The defense didn't do anything special with fancy blitzes; it just lined up and got pressure with four rushers. The offense took league-best field position and converted drives into points at the second-highest rate. They did so methodically, not gashing teams with big plays but marching down the field with a mix of efficient runs and short passes (part of the reason Carson Wentz scores so low in Air Yards). Limiting turnovers (to zero for the first three games) and capitalizing on opponent mistakes.
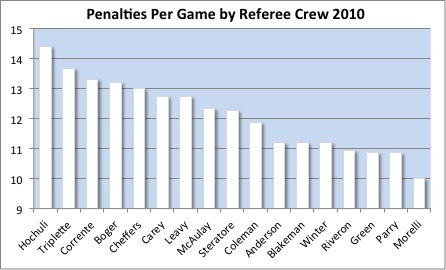
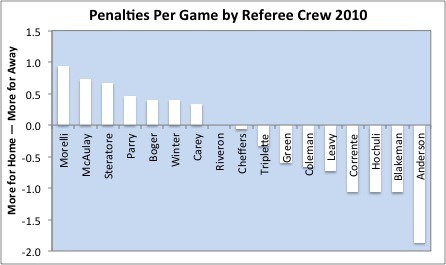
That strategy was effective until this started happening:

As far as I can tell, weeks five and six are the most penalties the Eagles have committed in consecutive weeks since 1989. And those penalties matter. According to friend of the blog Sean Taylor, each additional penalty a team has over its opponent is worth approximately -0.5 points. The Eagles have out-fouled their opponents by 16 in the last two weeks and, surprise, lost by a combined eight points. Add in a couple more unforced errors, like a rookie fifth round pick stumbling out of the gate and a veteran running back fumbling at the worst possible time, and you can see how the Eagles went from 3-0 to 3-2.
Again, this is not to bury them. They are still a good team that should be at least in the race all season. But it's not like teams we've seen in years past that could spot an opponent a three touchdown lead and roar back in the final minutes. There are too few #playmakers and not enough strengths. That means they either have to return to the suffocating competence of the early season—limiting turnovers and penalties, staying efficient on offense, and preventing big plays on defense—or come up with a new way to win... like putting more in Wentz's seemingly-capable hands.