Ranking The 2013 NFL Kickers (Or Why Alex Henery Doesn't Deserve Your Support)

Everyone knows that NFL kickers are getting better. The numbers make this obvious. We saw an all-time high for field goal accuracy in 2013: over 86%. And that's despite many more long attempts. Field goal tries from over 50 yards have increased 57% in the last decade.

When ranking kickers, we have to take into account the new landscape. For an example, just look close to home. After his first three seasons, Alex Henery is tied for fourth all time in overall field goal accuracy among players with at least 80 attempts. But if you check out the top 20 on that list, 17 of them played in the last two years. This is like the late 1990s in baseball -- everyone's breaking records.

More to the point, we can't quote field goal accuracy without taking distance into account. As Jimmy Kempski noted, Henery doesn't look nearly as good when you compare him to his peers. Among full time kickers since 2011, Henery is tied for the fewest attempts over 50 yards (5). He also has the shortest "long field goal" (51). If everyone else is taking longer attempts and making them, Henery's value is significantly lower than his overall accuracy would suggest.

Last offseason, I took a deep dive into Henery's value, comparing him to other kickers in 2012. By generating an estimated value for every kick, we could plot how much each kicker actually contributed to his team as compared to the league standard. The results put Henery just a hair above average, with the noted caveat of having not a single make over 50 yards.

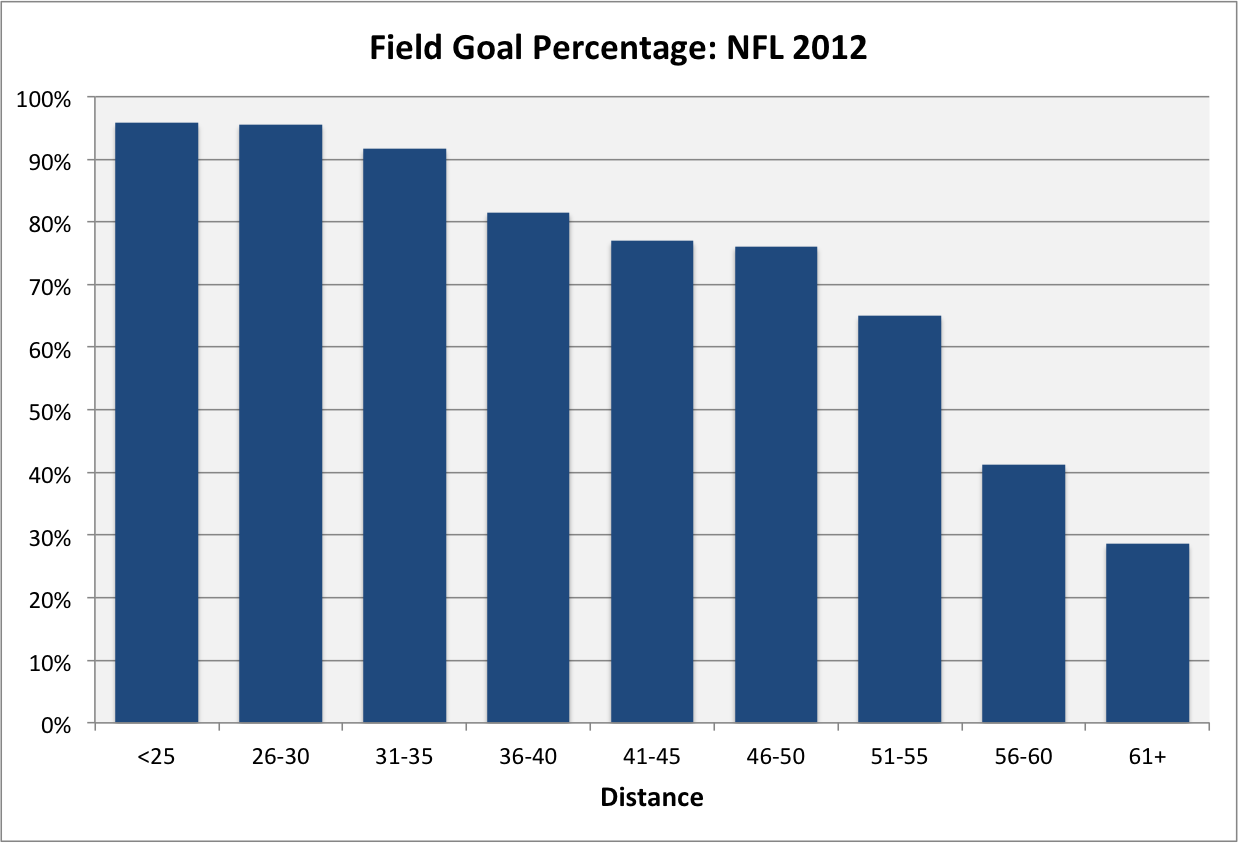
This year I wanted to go deeper. To start, I pulled all 2013 field goal attempts and plotted them out. While upgrading from last year's 5-yard buckets required a little smoothing, the granular data this year should be more exact:

Cool, right? As you can see, kicks from in close are automatic and everything up to about 32 yards out is a 90% success rate or higher. But perhaps even more impressive, kickers in 2013 maintained over 80% accuracy up to 45 yards out -- and 70% all the way to 55 yard attempts. The data gets meager from there, but the graph is proof of how great NFL kickers have become.

Anyway, with this data, it becomes fairly easy to generate an estimated point value for every field goal attempt. For example, a 35 yard try is worth 2.63 points while a 50 yarder is worth 2.1 points. If a kicker makes a kick from that distance, he adds points to his team above the expected value. Missing, he loses his team the expected points. (The only major caveat here is weather conditions. Certainly a field goal into strong wind would have a lower expected value than one in a dome.)

This year, we'll also add kickoff analysis. I spent some time playing with large data sets of kickoffs and ultimately was disappointed by the many problems in the NFL's play by play data. So at least until Football Outsiders releases its always-awesome game charting this summer, I can't work with the type of granular data on field goals above. The next best thing is Pro Football Focus' kickoff stats. They track distance, touchbacks, and average yard line start. I adjusted that data to eliminate the effect of onside kicks, but there are other variables (including weather) which still exist outside the scope of the investigation.

For kickoffs, the goal is to reach a similar expected value score. With help from Derek Sarley, we calculated a quick and dirty correlation between touchbacks and starting drive position of .67, suggesting that kickers have about two-thirds of the responsibility on kickoffs. Using that, we can multiply each kicker's total drive start yardage difference from the league average by .67, then by the approximately 0.06 expected points each extra yard is worth. Again, it's not a perfect score, but it will give us a good estimate.

Got all that? Click on the table below to enlarge the full results:

Hopefully the table isn't too confusing. Let's break it down. The left hand side is kickoff data, and you can see adjusted kickoff distance and drive start. From there you can calculate points generated in relation to the average kicker (KICKOFF PTS). On the right side are field goals, first the basic data then the estimated values based on the calculations above, leading to the FG PTS above or below average. Finally, TOTAL PTS combines the two scores and ranks all kickers (including those who only kickoff or attempt field goals).

The best kickers of 2013 did well on both metrics. Dan Bailey of the Cowboys, for example, helped force opponents to start their drives 1.9 yards further back than average. Over the course of the season, that was worth just over a touchdown in field position. On field goals, he made over 93% of his attempts, when the average kicker would have only made 84.5%. That was another 8 points he generated for Dallas, bringing Bailey's total points over average to a league-leading 15.1. If we can translate that using Brian Burke's data at Advanced NFL Stats, Bailey was worth about as much in expected points added as the 25th-ranked quarterback.

On the other end of the spectrum, Henery ranked third-worst in the NFL last year. He lost the Eagles approximately 10.8 points, split about equally between kickoffs and field goals. Henery was near the bottom of the pack in kickoff distance and average drive start, losing 1.6 yards per kickoff. Meanwhile, his 80% field goal accuracy should have been better, given he took mostly shorter kicks. The league average accuracy for his attempts would have been 85.8%.

Though Henery has some ardent supporters, it's tough to find any silver lining for him in these numbers. Only two kickers in this sample had worse results: a historically-bad rookie and a veteran who was fired in December. Maybe Henery can improve this offseason and post a better effort in 2014. But I wouldn't count on it. At the very least, the Eagles must bring in competition for what is clearly one of their weakest positions.

Why Nick Foles Is Better Than Ever (But Can't Stay This Good)

I call him SuperNick. The man who threw seven touchdown passes in little more than three quarters of play deserves such a cartoon moniker. But how did "one of the better backups in the NFL" become in one afternoon the guy who plays what "might have been the best three-quarters of a game we've ever witnessed"?

The simple answer is, he didn't. With the notable exception of four horrendous quarters against Dallas where he looked like he sustained a concussion before he ever got to the stadium, Foles has looked good all year. Andy Reid and Marty Mornhinweg may have the quarterback guru reputation, but Chip Kelly's offense has been much friendlier to QBs than he gets credit for. Why? Because his spread-option, up tempo, zone read running attack forces opponents to pick their poison. Kelly has repeated versions of this quote for years:

"They can't defend it all. I'm really happy with how we threw the ball. If you're going to devote nine guys and try to stop the run, God bless you, and we'll throw it."

Since early in the season, defenses have made their choice: plug the box with seven or eight players and keep just one safety back deep. That often leaves man-to-man coverage on the outside against DeSean Jackson and Riley Cooper. Those are golden matchups for a quarterback, but the Eagles haven't executed. As Sheil Kapadia wrote after the Cowboys game, "An average QB performance likely would have yielded 300+ yards and a score in the 20s." Unfortunately, Foles couldn't make that happen. Neither could Matt Barkley, as Derek Sarley showed last week.

Jump ahead to the Raiders game, and Foles finally started taking advantage of those one-on-one matchups, just as he did against the Buccaneers. Fran Duffy diagrammed all 7 TDs, and over and over you saw Cooper and Jackson beating man coverage -- and passes actually finding them. The gains were comical. Check out how Foles' numbers on long passes differ from last year (stats courtesy Pro Football Focus):

Screen Shot 2013-11-05 at 12.07.52 AM.png

To start with, Foles is attempting about 50% more long passes than he did with Andy Reid at the helm. That's a big jump. His current rate of 16.1% is near the top of the league, after placing in the bottom half last season. This change is entirely about the offense; Michael Vick has also seen a spike in his deep balls, bringing him back to 2010 levels after declines the last two years.

But where things start to get crazy is the long ball effectiveness. Foles completed only 36% of passes 20 yards or longer in 2012. That's up to nearly 53% so far this year. Long ball completion percentage is a huge indicator of success. Look at the list of QBs who posted 48% or above last year: Kaepernick, Rodgers, P. Manning, Newton, Griffin, Brees, Wilson. That's elite territory.

Can Foles keep that completion rate up? Unclear. While there may be some regression to the mean, I'm actually bullish on this front. Kelly's offense seems to be giving his QBs a boost. Vick has also seen a double-digit jump in 20+ yard completion rate, so Foles' numbers may not be an aberration.

Touchdown and interception rates are another matter. Foles is averaging an insane four TDs for every ten long passes he throws. Eight out of his ten completions at that distance have gone for six points. He also has no interceptions at any distance all year -- the only quarterback with more than 75 passes who can say that. (No fumbles either.)

Even if the completion percentage stands, those most certainly won't. Last year, RGIII led the league in touchdown rate on passes of 20 yards or more -- at only 19.4%. Even if defenses don't significantly adjust their coverage schemes (although I expect they'll have to back out of the box more now), Foles simply can't count on the type of luck he's had so far with defenders falling down, receivers wide open, and more. He also eventually will start throwing interceptions. Last year he threw them on just 1.9% on all throws, but Football Outsiders' adjusted interception rate showed a more pedestrian 4.2% after accounting for defenders dropping would-be picks.

The first takeaway here is that SuperNick's current outsized numbers will almost certainly come back to Earth. He may be good the rest of the year, but he won't be that good. The second takeaway is more important, though. Foles' improvement is only over a small sample, but it may not be an anomaly. Kelly is putting his quarterbacks in a great position to succeed, and when defenses change to prevent that, it will only give McCoy more room to run. If the Chip's scheme looks this good with competent QB play from a limited upside guy like Foles, think about what it might do with a true top-tier talent at the position.

Quarterback Draft Inflation: From Kafka to Foles

Nick Foles Arizona

I have a theory about the Eagles third round selection of quarterback Nick Foles. Despite the relatively early pick, it has nothing to do with replacing Michael Vick or even Mike Kafka. It’s about the NFL draft and the dramatic quarterback inflation that has occurred in the last two years.

Let’s take a quick journey back to 2010. Sam Bradford went first to the Rams and Denver jumped up to 25 overall to get Tim Tebow. The next quarterbacks off the board were Jimmy Clausen (#48), Colt McCoy (#85), and the Eagles’ Kafka (#122). That order of quarterbacks coming off the board — two in the opening round, another one in each of the following — is right in line with what had been going on ever since the draft was whittled down to seven rounds in 1994.

But that pattern, largely consistent for the previous 15 years, was thrown out the window over the last two. In 2011, four quarterbacks were drafted in the first round, and six in the top 40 picks. That rivaled two of the biggest quarterback-heavy drafts in recent memory, 1999 and 2004, despite talent that few considered equal. Then this most recent draft saw another four quarterbacks taken in the first, something that’s never happened in two straight years. Overall, the 2012 draft was slightly behind the 2011 pace, but it was still far ahead of nearly any prior draft.

Here, see for yourself, in table and graphical forms:

QB Draft Order Table

QB Draft Order Graph

What does this mean about Foles? It means that the Eagles likely drafted a worse quarterback in an earlier round than they ever would have before. For example, the team selected Kafka in the fourth round of 2010, presumably to be a long term backup they could groom. He was the fifth quarterback drafted overall.

Foles, taken a round and a half before Kafka, was only the seventh-best quarterback according to draft order. Perhaps this year’s crop of quarterbacks, and Foles in particular, is better than the group teams had to choose from in 2010 — and nearly every prior year. But my impression is that most experts considered this, pre-draft, to be at best an average class after the two stars.

Two years may be too soon to confirm a trend, but the evidence is there. Quarterbacks have never been more highly valued in the NFL. Desperate teams without a franchise signal-caller give big contracts to former backups and trade for anyone with promise. It only makes sense that such a frenzied demand would trickle down to the draft. As that happens, quarterbacks with starting potential rise from the second and third rounds into the top 30 picks, and those who might have been considered late round projects jump up to take their place.

Suddenly, this starts to look less like a fluke and more like a serious shift in how quarterback prospects are valued. We would be wise to view the Foles pick with that in mind.

Photo from Getty.

The Inadequacy of Opponent Adjustments

Semi-annual blogger Derek Sarley:

VOA is a measure of how well a team has played and DVOA corrects for opponents, so you can throw out any concerns about strength of schedule and say things like “DVOA proves the Eagles have the league’s twelfth-best defense, even if you claim they didn’t play very many teams that were any good.”

Except you can’t. DVOA says nothing of the kind, as we can best demonstrate with a couple of charts. Here’s the first one, plotting this season’s DVOAs against VOAs:

Long story short, opponent adjustments are nice, especially for comparing teams quickly. But DVOA and its ilk will never be able to provide a complete understanding of a single team or unit. Even advanced stats need context.

Follow Up: What a Good Team Looks Like

On Monday, I demonstrated one flaw in the composition of the 2011 Eagles. There are too many starters who are new to the team, because they’re either recent draft picks or recent free agent pickups.

But just for comparison’s sake, here’s what a good team looks like. The 2011 Eagles starters overlaid with the (currently 12-0) 2011 Green Bay Packers starters, arranged by number of years with their respective teams:

Eagles Packers Team Composition

(Click for bigger version.)

The Sad Decline of Donovan McNabb

Donovan McNabb Vikings

It’s been awhile since I’ve talked about Donovan McNabb.

Take a gander at the chart below. It’s an updated variant on the graphs I put together back before McNabb was traded to the Redskins.

Yuck. The last two years have not been kind to McNabb. Both in Washington last year and with the Vikings this year, he’s scored solidly at the bottom of NFL quarterbacks.

You can read the graph two different ways, although neither are positive for Donovan.

First, you can just plot a steady decline in performance since 2006. In that season he put up numbers akin to the Super Bowl year. Afterward, even through Brian Westbrook’s masterful season of 2007 and the emergence of the young guns in 2008 and 2009, McNabb could never again match those peak years.

Before he was traded there were warning signs of his decline. 2009 saw his lowest DVOA performance since 2002 and his lowest EPA since 2005. Perhaps that trend would have continued in Philadelphia.

The second understanding of the graph comes instead from the sharp dropoff in 2010. From 2007-2009 McNabb largely hovered just above average, as the 10th- to 15th-best quarterback in the league. As soon as he started in Washington, however, he plummeted to 25th-best. Every notable stat fell.

There is no doubt that the difference is large between the Eagles offense and those in Washington and Minnesota. That’s a potential excuse for McNabb, if you’re looking for one. If he came back and started with the Eagles his numbers would probably look better. But the fact that he couldn’t elevate those teams and perform at least close to he did in Philadelphia doesn’t lend to any argument in his favor. Maybe Andy Reid was propping him up.

Or maybe it’s just age catching up to McNabb. 35 is old for an NFL player. This year only Tom Brady, Matt Hasselbeck, and Kerry Collins are seeing significant playing time among quarterbacks over age 32. Since he came into the league, McNabb has gained about 20 lbs and has lost his trademark speed.

No matter the reason, it’s sad to watch.

Photo from Getty.