This is the second post in a series examining the possible explanations for McNabb’s decline from the performance of his peak years (2004-2006).
Read the first part of this analysis: The Offensive Line.
* * *
Running Game
Let’s move on from the big uglies. Want to set us up, Derek?
And it’s not like McNabb got any help from the running game. The addition of Weaver kept it from being a complete loss, but I again think it’s funny that people expect McNabb to not be the least bit affected by Brian Westbrook going from “pretty much the entirety of the offense” to “he’s out again this week, isn’t he?”
This is a relatively easy narrative. Everyone’s been calling for a more balanced attack since Andy arrived in Philly, and recently the running game hasn’t even been any good.
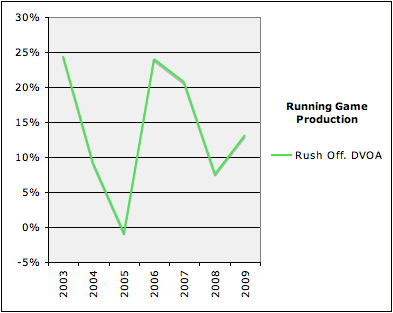
DVOA, a Football Outsiders stat, shows the effectiveness of the running game. Clearly that effectiveness has trailed off drastically over the last two years. Possible easy explanation for that: Brian Westbrook no longer being Brian Westbrook.
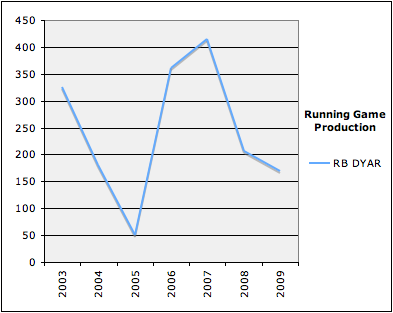
DYAR shows the actual production, rather than just the effectiveness, of the running game. This is normally an individual stat, but I ran the numbers for all running backs to calculate total production from all backs with 20 or more rushes in a season.
The more Andy dials up running plays, the higher the DYAR. You can see, for example, that while the effectiveness of the running game (DVOA) went up slightly from 2008 to 2009, the rushing attack was actually used less last year — lowering the overall production from backs.
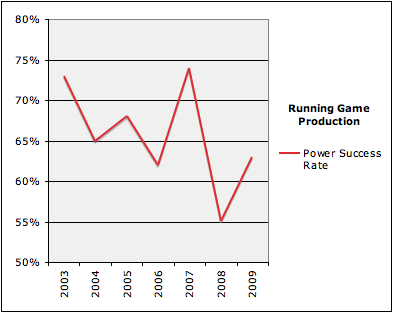
Another statistic from Football Outsiders, Power Success, calculates the rate of success of short yardage runs. This one includes all rushers, including quarterbacks, which makes it a little less dependant on running backs and more dependant on the offensive line’s ability to get that 1-2 yard push. And Power Success tells a similar story to the others: great year in 2007, fall off to 2008.
Now that we’ve seen the raw numbers, let’s put all of these stats together by analyzing how the Eagles perform against the rest of the league in all of these statistics:
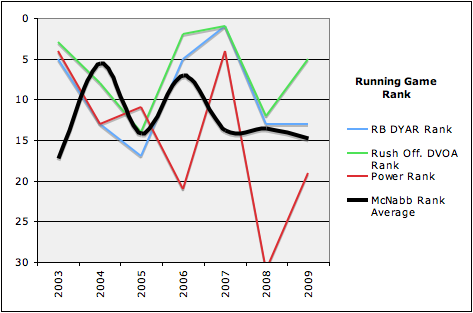
Here you go. DVOA (rushing efficiency) rank, DYAR (total RB production per team), and Power Success (rate of success in short yardage) showing the Eagles against the rest of the league. Plus, to see if we can spot any trends, I threw the previously-derived McNabb performance trendline is thrown in as well.
Initial observations:
- You can read this graph to some degree as an analysis of Brian Westbrook’s time as an Eagle. The running back groups he led for the last 7 years only once dipped below average in either DVOA or DYAR, and 2006 to 2007 was his heyday as one of the best runners in the NFL.
- The DVOA and DYAR ranks generally run together, which makes sense since they’re measuring similar things. If you take Andy Reid’s run-pass ratio into account as a given, production is mostly going to fluctuate based on how good/efficient those runners (and the offensive line blocking for them) are.
- However, 2009 shows the first sharp deviation from that trend. Total RB production stayed even with 2008, but the effectiveness of the individual runs was actually way up. It’s easy to deride the running game for poor production last year, but overall effectiveness was up from 12th to 5th in the league.
- Power Success highlights something that we as fans often noticed: the 2008 Eagles offense (also known as Year of No Fullback) could not buy a first down. The uptick last year didn’t put the team into the top half of the league, but the addition of Leonard Weaver clearly made a big impact nonetheless.
I think if McNabb’s production only fell from 2007 to 2008, you could make a solid case that the decline in the running game was directly tied to, if it didn’t cause, McNabb’s average to slightly above-average play.
But the problem is that the large drop-off occurred for the 07 season, followed by 2 more plateau years. 2007 was the height of Westbrook’s powers, but McNabb’s production hit a 4-year low — and then didn’t decline further as a result of the rapid decline of the rushing attack (especially in short yardage) during 2008. Donovan’s been constant while the running game bounces around. Clearly there’s still more at play here.
* * *
Stay tuned. An analysis of receiver talent and performance is coming soon.